
Contents:
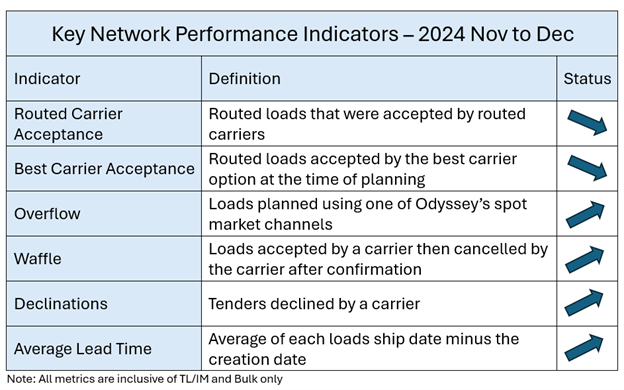
Key Odyssey Network Indicators
Shipper Actions
- Forecast for the end of month/end of quarter – plan for surges in your needs to assure coverage
- Develop order lead time – at least 5 days in advance. ask carriers for “best case” options
- Request delivery windows from customers…often 8 a.m. deliveries are requested when product really is not need until much later. A window of 8-10 a.m. may have a better chance of coverage.
- Spread delivery times our across the day
- Assess what your customers really need. Make sure that customer delivery requirements are up to date and accurate. Do not over-require equipment/assessorials that are not needed
- Offer flexible load times
- Explore/ be open to mode options including intermodal
- Load/unload within the normal 2 hours-time is money to drivers
- Provide creature comforts (clean restrooms, rest areas, free Wi-Fi, a cup of coffee, etc.)
- Offer consistent volume that carriers can plan against
- Reduce order changes – a new date may put coverage at risk
- Maximize payload on trucks
- Utilize trailer drop yards at high volume origins when possible
- Prioritize loading/unloading trucks quickly at facilities
- Pay carriers within their contracted freight terms- cash flow is vital to carriers
Economic Update
GDP Change
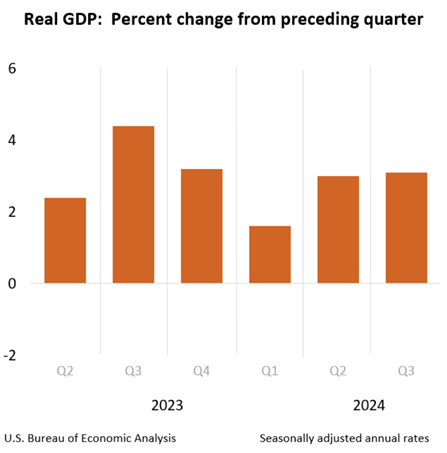
- Real gross domestic product (GDP) increased at an annual rate of 3.1 percent in the third quarter of 2024 (table 1), according to the “third” estimate released by the U.S. Bureau of Economic Analysis. In the second quarter, real GDP increased 3.0 percent.
- This GDP estimate is based on more complete source data than were available for the “second” estimate issued last month, where the increase in real GDP was 2.8 percent.
- The update primarily reflected upward revisions to exports and consumer spending that were partly offset by a downward revision to private inventory investment.
- Imports, which are a subtraction in the calculation of GDP, increased and were revised up.
- Compared to the second quarter, the deceleration in real GDP in the third quarter primarily reflected a downturn in private inventory investment and a larger decrease in residential fixed investment. These movements were partly offset by accelerations in exports, consumer spending, and federal government spending. Imports accelerated.
Inflation / CPI
https://www.bls.gov/charts/consumer-price-index/consumer-price-index-by-category.htm
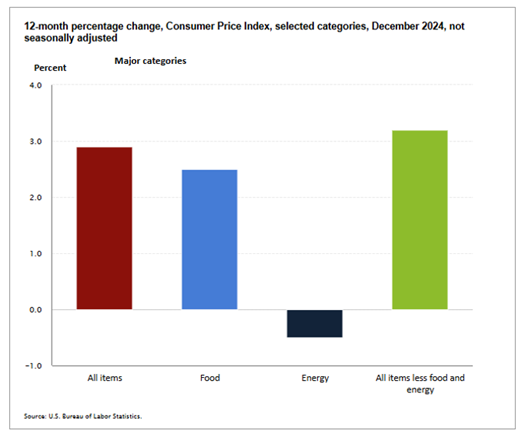
- The all-items index rose 2.9 percent for the 12 months ending December, after rising 2.7 percent over the 12 months ending November. The all items less food and energy index rose 3.2 percent over the last 12 months. The energy index decreased 0.5 percent for the 12 months ending December. The food index increased 2.5 percent over the last year.
- The Consumer Price Index for All Urban Consumers (CPI-U) increased 0.4 percent on a seasonally adjusted basis in December, after rising 0.3 percent in November, the U.S. Bureau of Labor Statistics reported today.
- The index for all items less food and energy rose 0.2 percent in December, after increasing 0.3 percent in each of the previous 4 months. Indexes that increased in December include shelter, airline fares, used cars and trucks, new vehicles, motor vehicle insurance, and medical care. The indexes for personal care, communication, and alcoholic beverages were among the few major indexes that decreased over the month.
Unemployment

https://www.bls.gov/charts/employment-situation/civilian-unemployment-rate.htm
- Total nonfarm payroll employment increased by 256,000 in December, and the unemployment rate changed little at 4.1 percent, according to the U.S. Bureau of Labor Statistics.
- Employment trended up in health care, government, and social assistance. Retail trade added jobs in December, following a job loss in November.
- This news release presents statistics from two monthly surveys.
- The household survey measures labor force status, including unemployment, by demographic characteristics.
- The establishment survey measures nonfarm employment, hours, and earnings by industry.
Household Survey Data
- The unemployment rate changed little at 4.1 percent in December. After increasing earlier in the year, the unemployment rate has been either 4.1 percent or 4.2 percent for the past 7 months. The number of unemployed people, at 6.9 million, also changed little in December.
- In December, the number of long-term unemployed (those jobless for 27 weeks or more) changed little at 1.6 million but is up by 278,000 from a year earlier. The long-term unemployed accounted for 22.4 percent of all unemployed people in December.
- The labor force participation rate, at 62.5 percent, was unchanged over the month and has remained in a narrow range of 62.5 percent to 62.7 percent since December 2023. The employment-population ratio, at 60.0 percent, changed little over the month and over the year.
- The number of people not in the labor force who currently want a job, at 5.5 million, was unchanged in December. These individuals were not counted because they were not actively looking for work during the 4 weeks preceding the survey or were unavailable to take a job.
- Total nonfarm payroll employment rose by 256,000 in December. Employment trended up in health care, government, and social assistance. Retail trade added jobs in December, following a job loss in November. Payroll employment rose by 2.2 million in 2024 (an average monthly gain of 186,000), less than the increase of 3.0 million in 2023 (an average monthly gain of 251,000).
- Retail trade added 43,000 jobs in December, following a loss of 29,000 jobs in November. In December, employment increased in clothing, clothing accessories, shoe, and jewelry retailers (+23,000); general merchandise retailers (+13,000); and health and personal care retailers (+7,000). Building material and garden equipment and supplies dealers lost jobs (-11,000). Overall, employment in retail trade changed little in 2024, following an average monthly increase of 10,000 in 2023.
- Employment showed little change over the month in other major industries, including mining, quarrying, and oil and gas extraction; construction; manufacturing; transportation and warehousing; professional and business services; and other services.
- In December, average hourly earnings for all employees on private nonfarm payrolls rose by 10 cents, or 0.3 percent, to $35.69. Over the past 12 months, average hourly earnings have increased by 3.9 percent. In December, average hourly earnings of private-sector production and nonsupervisory employees, at $30.62, were little changed (+6 cents).
U.S. Truck Transportation Employment
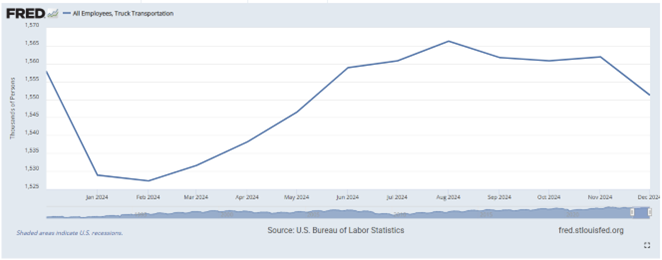
- At 1.551M in December compared to 1.563M in November, on a non-seasonally adjusted basis
- And only slightly below the 1.558M persons employed in December 2023
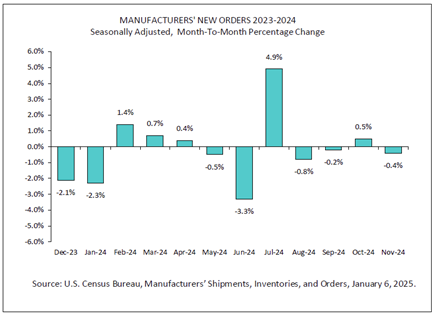
Manufactured Goods – New Orders
https://www.census.gov/manufacturing/m3/current/index.html
- New orders for manufactured goods in November, down three of the last four months, decreased $2.1 billion or 0.4 percent to $586.1 billion, the U.S. Census Bureau reported today. This followed a 0.5 percent October increase.
- Shipments, following three consecutive monthly decreases, increased $0.7 billion or 0.1 percent to $586.3 billion. This followed a 0.2 percent October decrease.
- Unfilled orders, up fifty-one of the last fifty-two months, increased $4.6 billion or 0.3 percent to $1,404.8 billion. This followed a 0.5 percent October increase.
- The unfilled orders-to-shipments ratio was 7.07, up from 7.04 in October. Inventories, following two consecutive monthly decreases, increased $2.5 billion or 0.3 percent to $859.3 billion. This followed a 0.1 percent October decrease.
- The inventories-to-shipments ratio was 1.47, up from 1.46 in October.
Transportation Update
Fuel
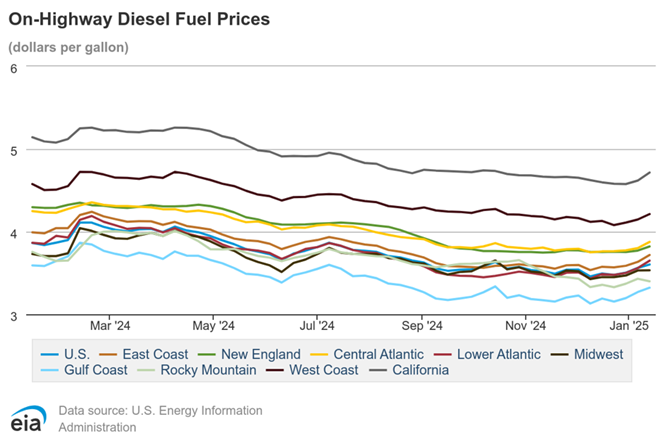
https://www.eia.gov/petroleum/gasdiesel/?os=frefapp
The national average price of diesel for the week of December 30 stood at $3.52 per gallon, a decrease of 2 cents from four weeks prior in November.
Transportation Capacity
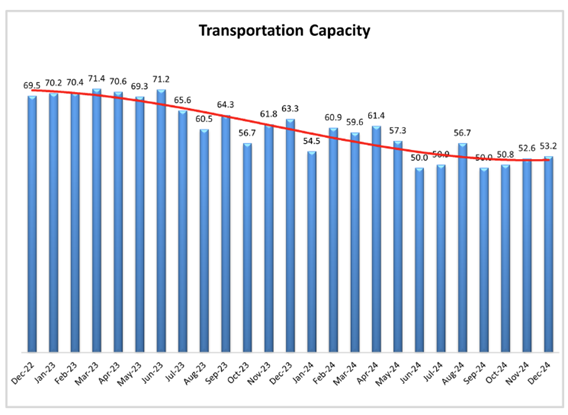
https://www.the-lmi.com/december-2024-logistics-managers-index.html
- The Transportation Capacity Index registered 53.2 in December 2024. This constitutes a small increase of .6 points from last month’s reading. As such, with this third consecutive increase the Transportation Capacity index remains on a slight upward trajectory and above the critical threshold.
- Despite this increase, the index is at more than 10 points below the level indicated one year ago and more than 16 points below the level indicated two years ago. As such, the Transportation Capacity index, although in expansion territory and on a slight increasing trajectory, remains relatively subdued
- The future Transportation Capacity index is slightly down, now at 50.0 indicating expectations of stable Transportation Capacity over the next 12 months.
Transportation Prices
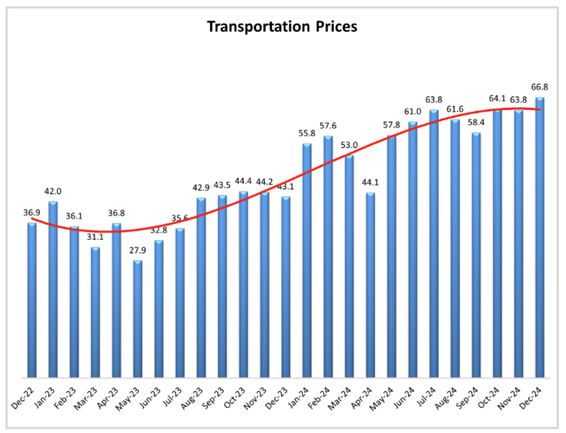
https://www.the-lmi.com/december-2024-logistics-managers-index.html
- The Transportation Prices Index indicates 66.8 in December 2024, which corresponds to an increase of 3 points from the previous month, establishing a new two-year maximum. As such, the upwards pressure on the Transportation Price Index resumes.
- The future index for Transportation Prices retreats 3.9 points and is now at 77.0. Despite this retreat, the index continues to indicate very strong expectations of higher Transportation Prices in the next 12 months.
Cass Freight & Truckload Index

Source: Cass Information Systems, Inc.
https://www.cassinfo.com/freight-audit-payment/cass-transportation-indexes/december-2024
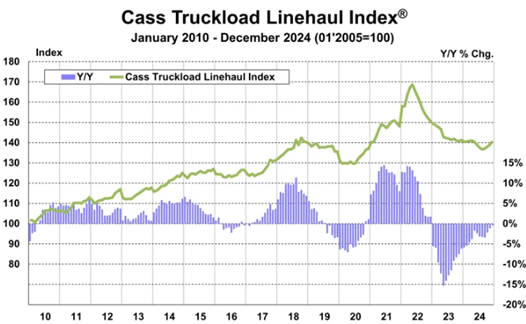
Source: Cass Information Systems, Inc.
https://www.cassinfo.com/freight-audit-payment/cass-transportation-indexes/truckload-linehaul-index
The Cass Truckload Linehaul Index is a measure of market fluctuations in per-mile truckload linehaul rates, independent of additional cost components such as fuel and accessorials.
The Cass Truckload Linehaul Index rose 1.2% m/m in December, the fourth straight small increase from a cycle low in August
- The year-over-year decline narrowed to 0.4% in December from 1.1% in November. This index may turn positive for the first time in two years, possibly as early as January.
- This index is a broad truckload market indicator and includes both spot and contract freight. Year-over-year spot rates have been positive for approximately six months. Contract rates are also increasing in recent bid activity.
- This index fell 10% in 2023 and another 3% in 2024. It is uncertain where the index will go in 2025.
Truck Tonnage Index
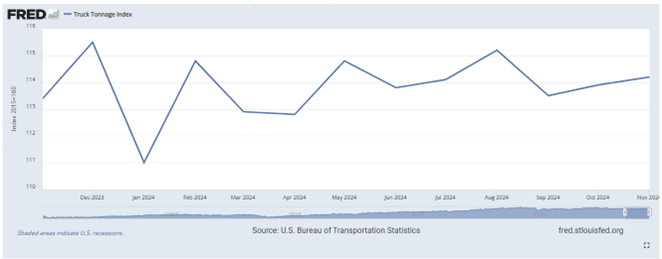
- The ATA projects that after two years of declines, truck volumes are expected to grow 1.6% in 2025, rising to nearly 14 billion tons by 2035. This projection comes from ATA Freight Transportation Forecast 2024 to 2035, a joint report by ATA and S&P Global Market Intelligence.
- “In this edition of Forecast, the trucking industry continues to dominate the freight transportation industry in terms of both tonnage and revenue, comprising 72.7% of tonnage and 76.9% of revenue in 2024,” said ATA Chief Economist Bob Costello. “We project that market share to hold over the next decade as the country continues to rely on trucking to move the vast majority of freight.”
- From the same report, total truck tonnage will rise from approximately 11.27 billion tons in 2024 to 13.99 billion tons in 2035. Over that same period, trucking industry revenues will grow from an estimated $906 billion to $1.46 trillion, accounting for 76.8% of the freight market by the end of the forecast period.
- Considering other modes of Transportation:
- Railroad freight tonnage share will fall from 10.6% in 2024 to 9.9% in 2035, mostly due to declines in coal volume.
- Intermodal rail tonnage will grow by 2.9% through 2030, and then 2.8% between 2031 and 2035.
- Air cargo, domestic waterborne transportation and pipelines will all see increases in tonnage between 2024 and 2035.
Van Load-Truckload Ratio
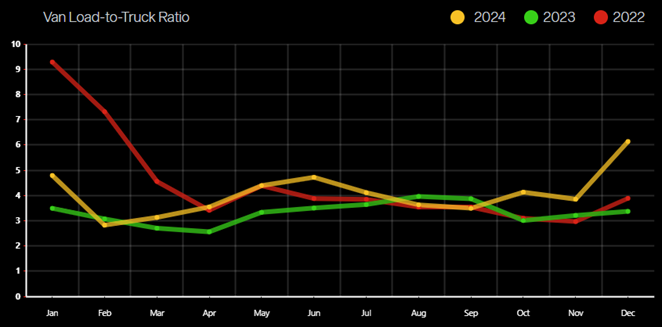
Source: DAT Analytics | https://www.dat.com/trendlines/van/demand-and-capacity
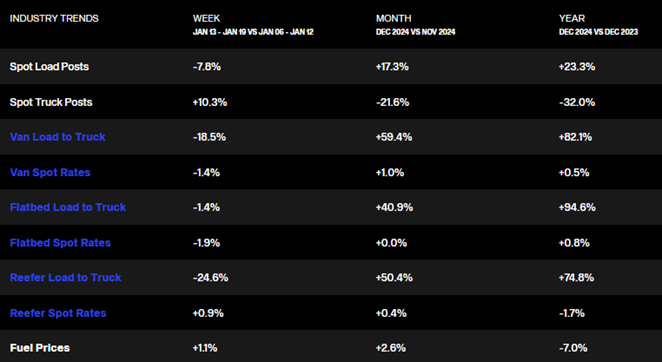
National Spot Rates
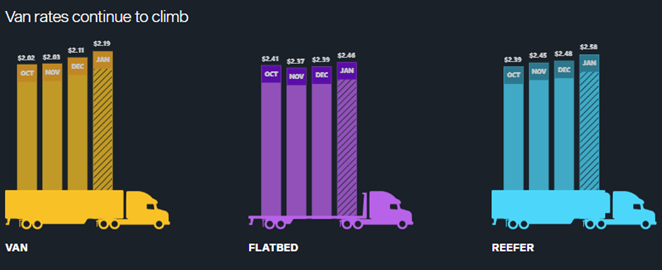
Source: DAT Analytics | https://www.dat.com/trendlines
The chart above depicts national average rates (including fuel surcharges) in the past 13 months, derived from DAT RateView.