Contents:
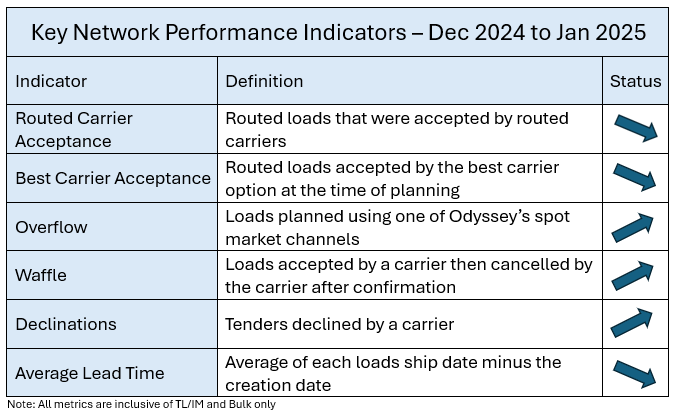
Key Odyssey Network Indicators
Shipper Actions
In today’s competitive environment, becoming a preferred shipper to carriers can help improve attaining sufficient capacity. Things that shippers offer that help reach this status can include:
- Forecast for the end of month/end of quarter – plan for surges in your needs to ensure coverage
- Develop order lead time – at least 5 days in advance. ask carriers for “best case” options
Specificity:
- Request delivery windows from customers…often 8 a.m. deliveries are requested when product really is not need until much later. A window of 8-10 a.m. may have a better chance of coverage.
- Spread delivery times across the day
- Assess what your customers really need. Make sure that customer delivery requirements are up to date and accurate. Do not require equipment/assessorials that are not needed
Flexibility:
- Offer flexible load times
- Explore/ be open to mode options including intermodal
Driver-friendliness:
- Load/unload within the normal 2 hours-time is money to drivers
- Provide creature comforts (clean restrooms, rest areas, free Wi-Fi, a cup of coffee, etc.)
Consistency:
- Offer consistent volume that carriers can plan against
- Reduce order changes – a new date may put coverage at risk
Efficiency:
- Maximize payload on trucks
- Utilize trailer drop yards at high volume origins when possible
- Prioritize loading/unloading trucks quickly at facilities
Promptness:
- Pay carriers within their contracted freight terms- cash flow is vital to carriers
Economic Update
GDP Change
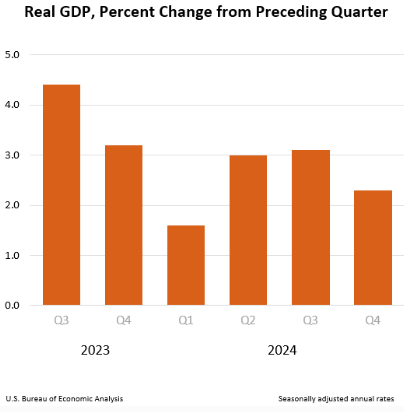
Gross Domestic Product | U.S. Bureau of Economic Analysis (BEA)
- Real gross domestic product (GDP) increased at an annual rate of 2.3 percent in the fourth quarter of 2024, according to the advance estimate released by the U.S. Bureau of Economic Analysis. In the third quarter, real GDP increased 3.1 percent.
- The GDP increase in real GDP in the fourth quarter primarily reflected increases in consumer spending and government spending that were partly offset by a decrease in investments.
- Imports, which are a subtraction in the calculation of GDP, decreased.
Unemployment
https://www.bls.gov/charts/employment-situation/civilian-unemployment-rate.htm
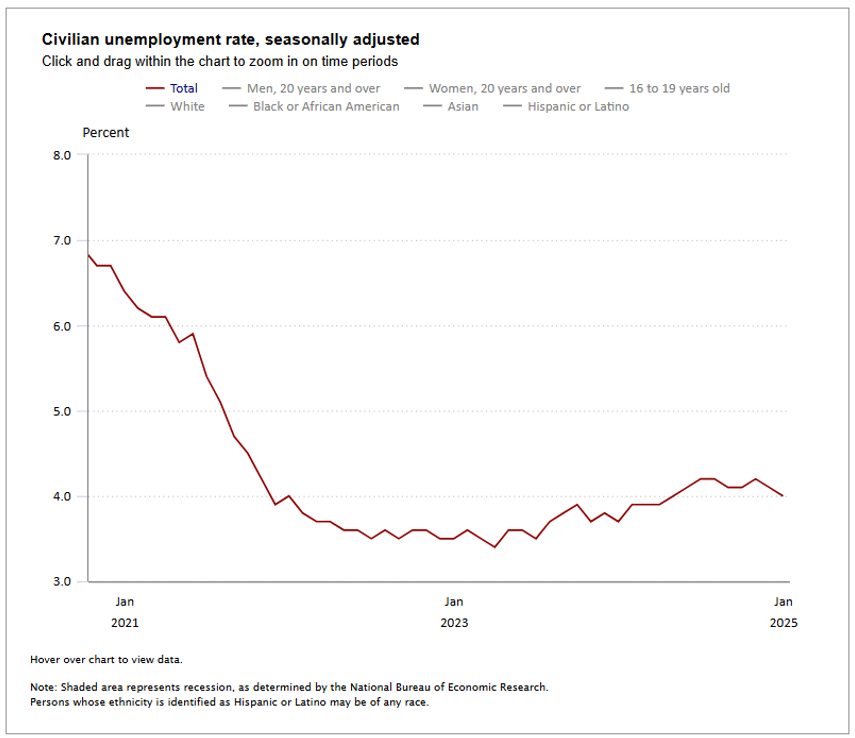
- Total nonfarm payroll employment rose by 143,000 in January, and the unemployment rate edged down to 4.0 percent, the U.S. Bureau of Labor Statistics reported today.
- Job gains occurred in health care, retail trade, and social assistance.
- Employment declined in the mining, quarrying, and oil and gas extraction industry.
- This news release presents statistics from two monthly surveys.
- The household survey measures labor force status, including unemployment, by demographic characteristics.
- The establishment survey measures non-farm employment, hours, and earnings by industry.
Household Survey Data
- The unemployment rate edged down to 4.0 percent in January, after accounting for the annual adjustments to the population controls.
- The number of unemployed people, at 6.8 million, changed little over the month.
- The number of long-term unemployed (those jobless for 27 weeks or more), at 1.4 million, changed little in January. The long-term unemployed accounted for 21.1 percent of all unemployed people.
- In January, both the labor force participation rate (62.6 percent) and the employment-population ratio (60.1 percent) were unchanged, after accounting for the annual adjustments to the population controls.
- The number of people who are not in the labor force who currently want a job, at 5.5 million, changed little in January. These individuals were not counted as unemployed because they were not actively looking for work during the 4 weeks preceding the survey or were unavailable to take a job.
Establishment Survey Data
- Total non-farm payroll employment rose by 143,000 in January, similar to the average monthly gain of 166,000 in 2024. In January, job gains occurred in health care, retail trade, and social assistance. Employment declined in the mining, quarrying, and oil and gas extraction industry.
- Employment in retail trade increased by 34,000 in January. Job gains occurred in general merchandise retailers (+31,000) and furniture and home furnishings retailers (+5,000). Electronics and appliance retailers lost 7,000 jobs. Retail trade employment had shown little net change in 2024.
- Social assistance added 22,000 jobs in January, led by individual and family services (+20,000). Employment also rose in the community food and housing, emergency, and other relief services industry (+4,000). Employment in social assistance grew by an average of 20,000 per month in 2024.
- Employment showed little change over the month in other major industries, including construction, manufacturing, wholesale trade, transportation and warehousing, information, financial activities, professional and business services, leisure and hospitality, and other services.
- In January, average hourly earnings for all employees on private nonfarm payrolls rose by 17 cents, or 0.5 percent, to $35.87. Over the past 12 months, average hourly earnings have increased by 4.1 percent. In January, average hourly earnings of private-sector production and nonsupervisory employees rose by 16 cents, or 0.5 percent, to $30.84.
U.S. Truck Transportation Employment
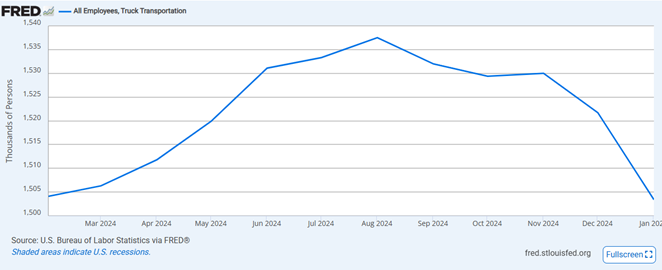
All Employees, Truck Transportation (CEU4348400001) | FRED | St. Louis Fed
Truck employment declined in January
- At 1.503M in January compared to 1.522M in December, on a non-seasonally adjusted basis
- And only slightly below the 1.508M persons employed in January 2024
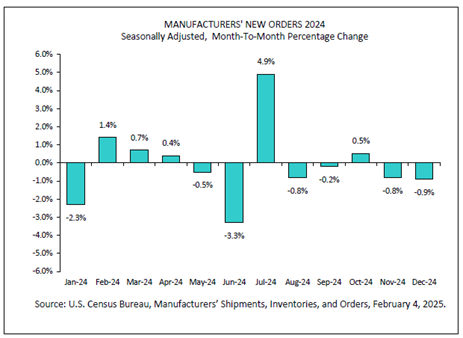
Manufactured Goods – New Orders
https://www.census.gov/manufacturing/m3/current/index.html
Monthly Full Report on Manufacturers’ Shipments, Inventories, & Orders
(Released February 04, 2025)
- New orders for manufactured goods in December, down four of the last five months, decreased $5.2 billion or 0.9 percent to $578.5 billion, the U.S. Census Bureau reported today. This followed a 0.8 percent November decrease.
- Shipments, up for two consecutive months, increased $3.7 billion or 0.6 percent to $589.7 billion. This followed a 0.1 percent November increase.
- Unfilled orders, down following five consecutive monthly increases, decreased $6.4 billion or 0.5 percent to $1,396.3 billion. This followed a 0.2 percent November increase.
- The unfilled orders-to-shipments ratio was 6.93, down from 7.06 in November. Inventories, up to two consecutive months, increased $3.3 billion or 0.4 percent to $863.2 billion. This followed a 0.4 percent November increase.
- The inventories-to-shipments ratio was 1.46, down from 1.47 in November.
Transportation Update
Fuel
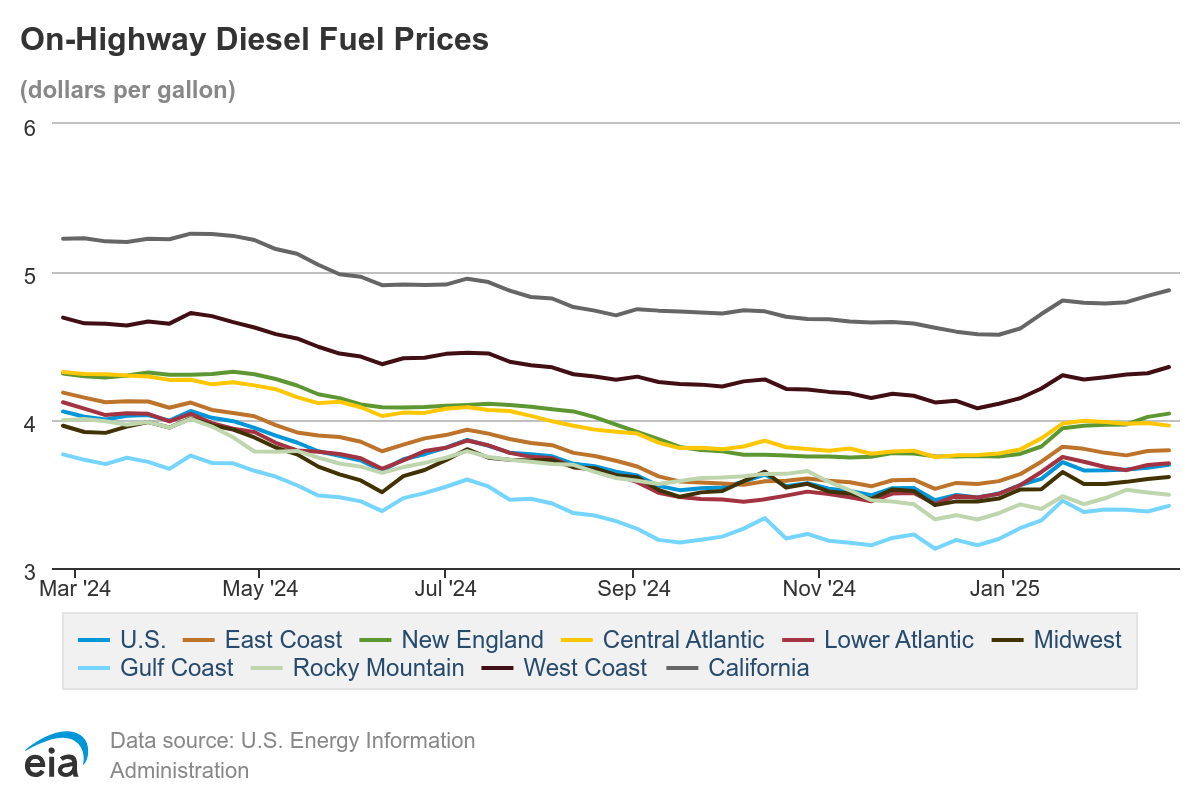
https://www.eia.gov/petroleum/gasdiesel/?os=frefapp
The national average price of diesel for the week of February 3 stood at $3.67 per gallon, an increase of 15 cents from four weeks prior in December and down $0.361 from a year ago.
Transportation Capacity
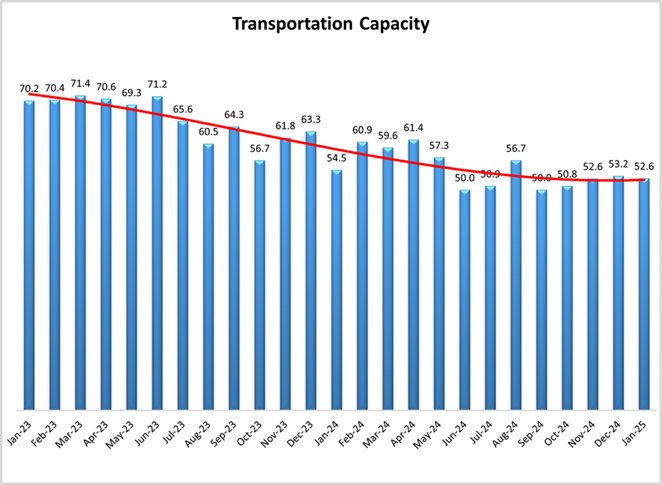
January 2025 Logistics Managers’ Index – LOGISTICS MANAGERS’ INDEX
- The Transportation Capacity Index dropped back to 52.6 in January 2025. This is a small decrease of 0.6 points from last month’s reading. This small drop breaks the slight upward trend.
- There is no significant difference between Upstream and Downstream, with Upstream Transportation Capacity index at 51.1 and the Downstream index at 55.4. The slight expansion trend in Transportation Capacity remains present both Upstream and Downstream, across the supply chains.
- The future Transportation Capacity index is holding steady at 50.0, indicating expectations of stable Transportation Capacity over the next 12 months.
Transportation Prices
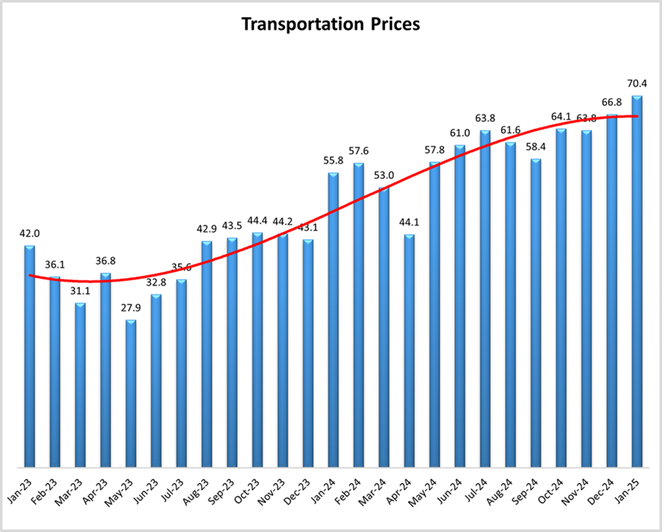
January 2025 Logistics Managers’ Index – LOGISTICS MANAGERS’ INDEX
- The Transportation Prices Index jumped to 70.4 in January 2025. This is an increase of 3.6 points from the previous month, establishing a new two-year maximum.
- The future index for Transportation Prices increases 4.1 points and is now at 81.1, indicating extremely strong expectations of higher Transportation Prices in the next 12 months.
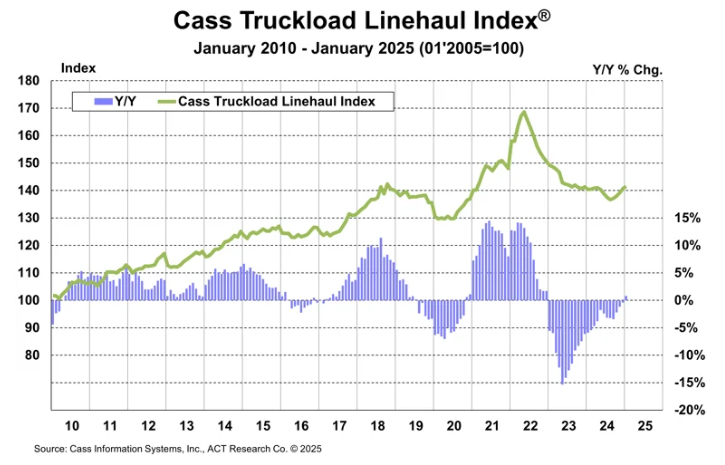
Cass Freight & Truckload Index
Linehaul Rates Turn Positive

Source: Cass Information Systems, Inc.
Cass Transportation Index Report | January 2025 | Cass Information Systems
Source: Cass Information Systems, Inc.
Cass Transportation Index Report | January 2025 | Cass Information Systems
The Cass Truckload Linehaul Index is a measure of market fluctuations in per-mile truckload linehaul rates, independent of additional cost components such as fuel and accessorials.
The Cass Truckload Linehaul Index rose 0.6% month-over-month in January, the fifth straight small increase from a cycle low in August.
- The year-over-year change rebounded to a 0.8% increase in January from a 0.4% decline in December.
- This is another important positive freight cycle inflection.
- This index fell 10% in 2023, and another 3% in 2024. 2025 is off to a positive start.
Truck Tonnage Index

ATA: Truck tonnage ‘unchanged’ in January
From the American Trucking Associations (ATA) on Feb 24, 2025:
- Trucking activity in the United States was unchanged in January, despite myriad factors that depressed freight volumes around the country, according to the American Trucking Associations’ advanced seasonally adjusted For-Hire Truck Tonnage Index.
- “After declines in November and December totaling 1.7%, tonnage was unchanged in January,” Bob Costello, ATA chief economist, said in a news release. “This outcome is impressive considering the massive winter storm that brought cold temperatures and significant snowfalls to large parts of the country, including those that rarely see such storms. Furthermore, the terrible wildfires in California likely also caused freight disruptions.
- “Softness in manufacturing and retail sales continue to be a drag on truck freight volumes as well, so the fact tonnage was flat is a positive sign.”
- In January, the ATA advanced seasonally adjusted For-Hire Truck Tonnage Index equaled 111.9, the same as December. The index, which is based on 2015 as 100, was up 0.3% from the same month last year, the first year-over-year increase since August.
- The not seasonally adjusted index, which calculates raw changes in tonnage hauled, equaled 110 in January, 1.1% above December’s reading of 108.9, ATA reported.
Van Load-Truckload Ratio
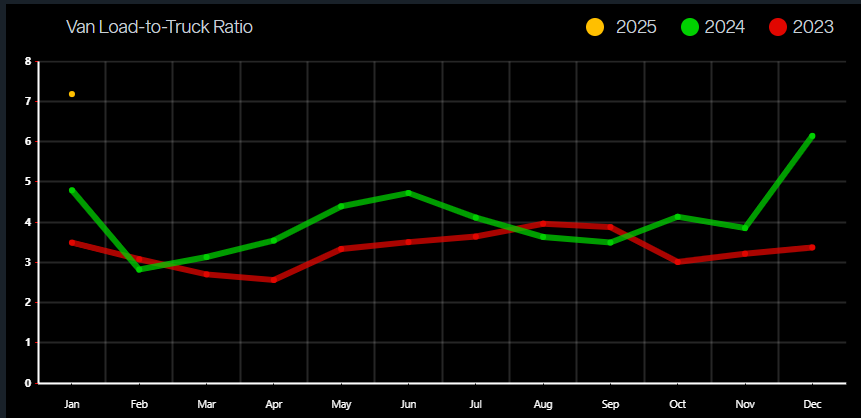
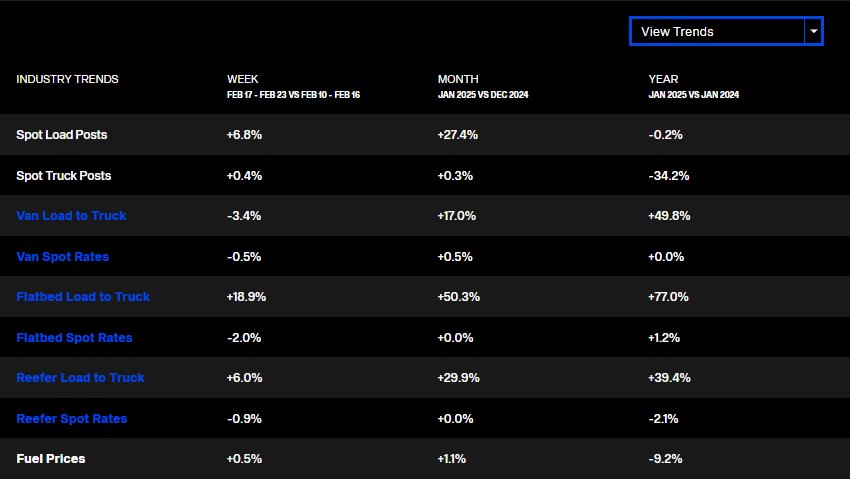
National Spot Rates
Source: DAT Analytics | https://www.dat.com/trendlines
The chart above depicts national average rates (including fuel surcharges) in the past 13 months, derived from DAT RateView.