
Contents:
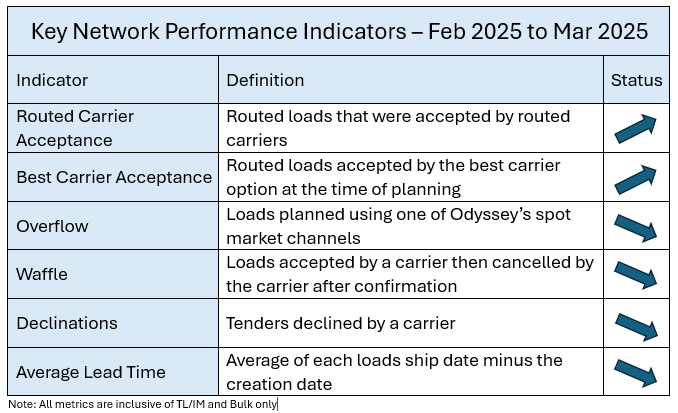
Key Odyssey Network Indicators
Shipper Actions
Accuracy:
Forecast for the end of month/end of quarter – plan for surges in your needs to ensure coverage
Develop order lead time – at least 5 days in advance. ask carriers for “best case” options
Specificity:
Request delivery windows from customers…often 8 a.m. deliveries are requested when product really is not need until much later. A window of 8-10 a.m. may have a better chance of coverage.
Spread delivery times across the day
Assess what your customers really need. Make sure that customer delivery requirements are up to date and accurate. Do not require equipment/assessorials that are not needed
Flexibility:
- Offer flexible load times
- Explore/ be open to mode options including intermodal
Driver-friendliness:
- Load/unload within the normal 2 hours-time is money to drivers
- Provide creature comforts (clean restrooms, rest areas, free Wi-Fi, a cup of coffee, etc.)
Consistency:
- Offer consistent volume that carriers can plan against
- Reduce order changes – a new date may put coverage at risk
Efficiency:
- Maximize payload on trucks
- Utilize trailer drop yards at high volume origins when possible
- Prioritize loading/unloading trucks quickly at facilities
Promptness:
- Pay carriers within their contracted freight terms- cash flow is vital to carriers
Economic Update
GDP Change
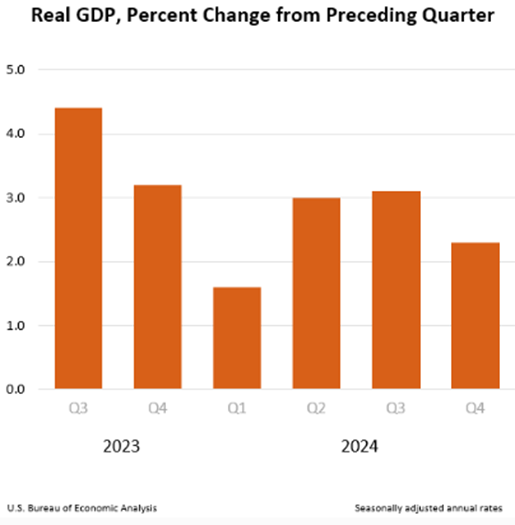
Gross Domestic Product | U.S. Bureau of Economic Analysis (BEA)
- Real gross domestic product (GDP) increased at an annual rate of 2.4 percent in the fourth quarter of 2024, according to the third estimate released by the U.S. Bureau of Economic Analysis. In the third quarter, real GDP increased 3.1 percent.
- The increase in real GDP in the fourth quarter primarily reflected increases in consumer spending and government spending that were partly offset by a decrease in investments.
- Imports, which are a subtraction in the calculation of GDP, decreased.
Unemployment
https://www.bls.gov/charts/employment-situation/civilian-unemployment-rate.htm
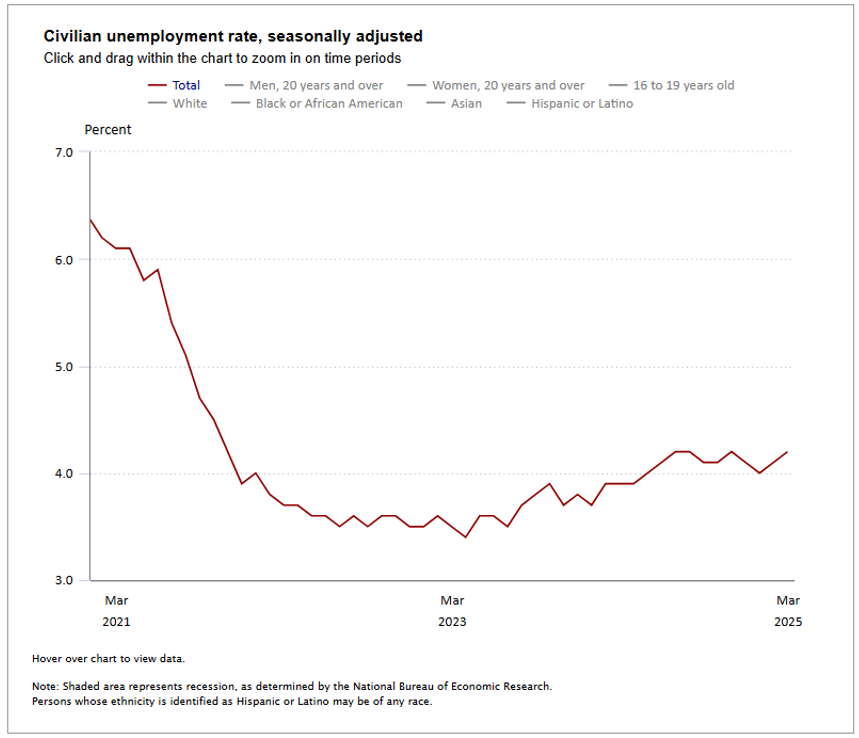
- Total non-farm payroll employment rose by 228,000 in March, and the unemployment rate changed little at 4.2 percent, the U.S. Bureau of Labor Statistics reported on April 4, 2025.
- Job gains occurred in health care, in social assistance, and in transportation and warehousing.
- This news release presents statistics from two monthly surveys.
- The household survey measures labor force status, including unemployment, by demographic characteristics.
- The establishment survey measures non-farm employment, hours, and earnings by industry.
Household Survey Data
- Both the unemployment rate, at 4.2 percent, and the number of unemployed people, at 7.1 million, changed little in March.
- The unemployment rate has remained in a narrow range of 4.0 percent to 4.2 percent since May 2024.
- The number of long-term unemployed (those jobless for 27 weeks or more), at 1.5 million, changed little in March. The long-term unemployed accounted for 21.3 percent of all unemployed people.
- The labor force participation rate, at 62.5 percent, changed little over the month and over the year.
- The number of people employed part time for economic reasons, at 4.8 million, changed little in March. These individuals would have preferred full-time employment but were working part time because their hours had been reduced, or they were unable to find full-time jobs.
Establishment Survey Data
- Total nonfarm payroll employment rose by 228,000 in March, higher than the average monthly gain of 158,000 over the prior 12 months. In March, job gains occurred in health care, in social assistance, and in transportation and warehousing.
- Employment in transportation and warehousing rose by 23,000 in March, about double the prior 12-month average gain of 12,000. In March, job gains in couriers and messengers (+16,000) and truck transportation (+10,000) were partially offset by a job loss in warehousing and storage (-9,000).
- Within government, federal government employment declined by 4,000 in March, following a loss of 11,000 jobs in February.
- Retail trade added 24,000 jobs in March, as workers returning from a strike contributed to a job gain in food and beverage retailers (+21,000). General merchandise retailers lost 5,000 jobs. Employment in retail trade changed little over the year.
- Employment showed little change over the month in other major industries, including mining, quarrying, and oil and gas extraction; construction; manufacturing; wholesale trade. information; financial activities; professional and business services; leisure and hospitality, and other services.
- In March, average hourly earnings for all employees on private non-farm payrolls rose by 9 cents, or 0.3 percent, to $36.00. Over the past 12 months, average hourly earnings have increased by 3.8 percent. In March, average hourly earnings of private-sector production and nonsupervisory employees edged up by 5 cents, or 0.2 percent, to $30.96.
U.S. Truck Transportation Employment

Manufactured Goods – New Orders
https://www.census.gov/manufacturing/m3/current/index.html
Monthly Full Report on Manufacturers’ Shipments, Inventories, & Orders
(Released April 2, 2025)
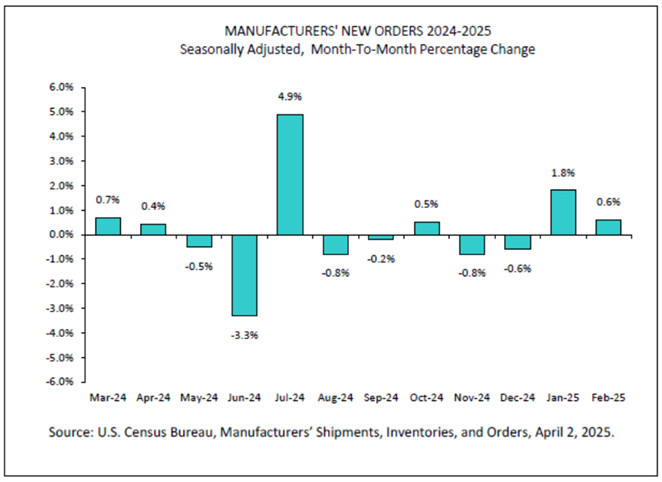
- New orders for manufactured goods in February, up two consecutive months, increased $3.6 billion or 0.6 percent to $594.0 billion, the U.S. Census Bureau reported today. This followed a 1.8 percent January increase.
- Shipments, up four consecutive months, increased $4.2 billion or 0.7 percent to $596.8 billion. This followed a 0.5 percent January increase.
- Unfilled orders, up seven of the last eight months, increased $2.1 billion or 0.1 percent to $1,402.7 billion. This followed a 0.2 percent January increase.
- The unfilled orders-to-shipments ratio was 6.81, down from 6.84 in January. Inventories, up four consecutive months, increased $1.3 billion or 0.1 percent to $864.9 billion. This followed a 0.1 percent January increase.
- The inventories-to-shipments ratio was 1.45, down from 1.46 in January.
Transportation Update
Fuel
https://www.eia.gov/petroleum/gasdiesel/?os=frefapp
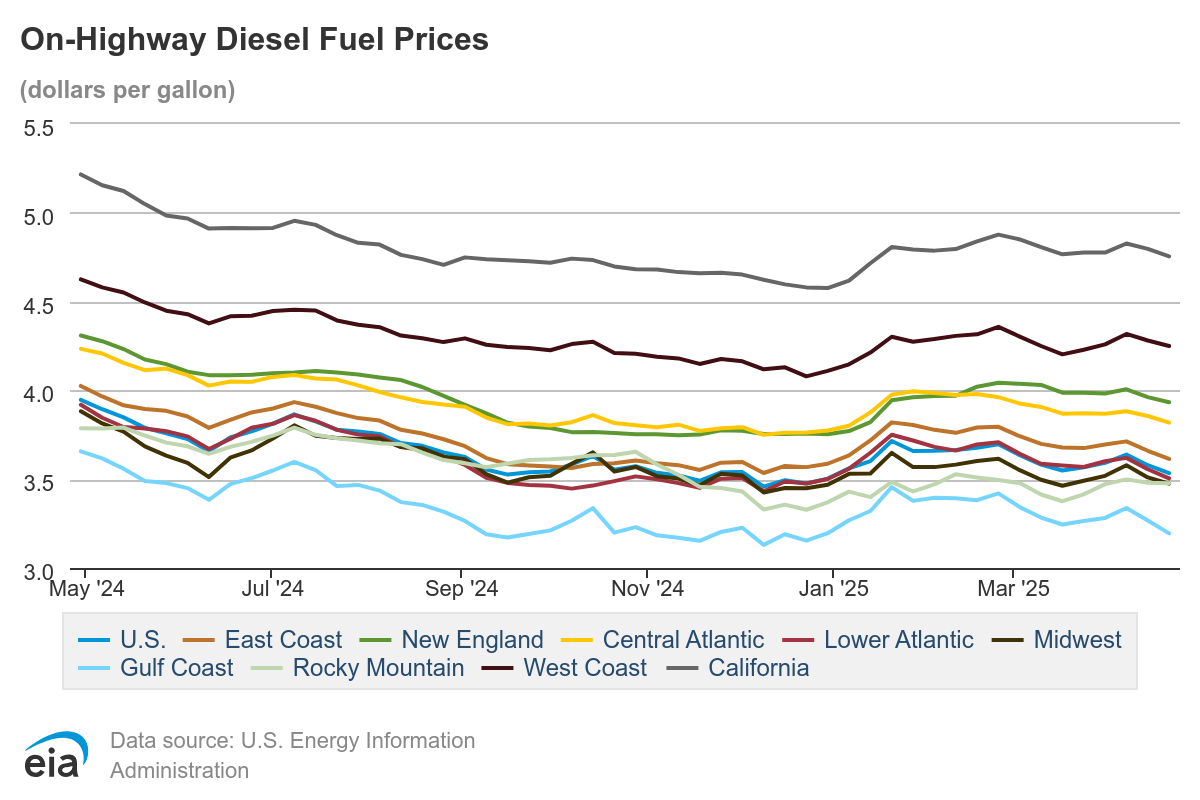
The national average price of diesel for the week of March 31 stood at $3.64 per gallon, a decrease of 5 cents from four weeks prior at the end of February and down $0.458 from a year ago.
Transportation Capacity
March 2025 Logistics Managers’ Index – LOGISTICS MANAGERS’ INDEX
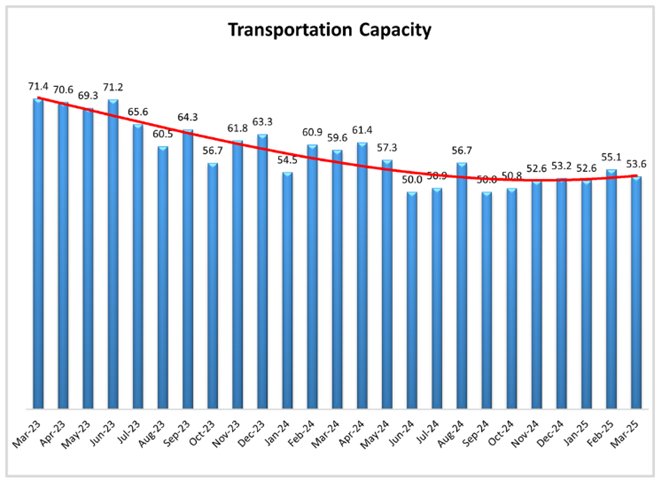
- The Transportation Capacity Index fell back down to 53.6 percent in March 2025. This constitutes a decrease of 1.5 percentage points from last month’s reading. Although this level is slightly higher than that recorded three months ago, it is 6 points lower than a year ago and 17.8 points below the level recorded two years ago.
- There is no significant difference between Upstream and Downstream, with Upstream Transportation Capacity index at 52.8 and the Downstream index at 55.6. As such, despite the drop, the slight expansion trend in Transportation Capacity remains present both Upstream and Downstream, across the supply chains.
- The future Transportation Capacity index is now at 51.5, indicating expectations of a slightly increasing Transportation Capacity over the next 12 months.
Transportation Prices
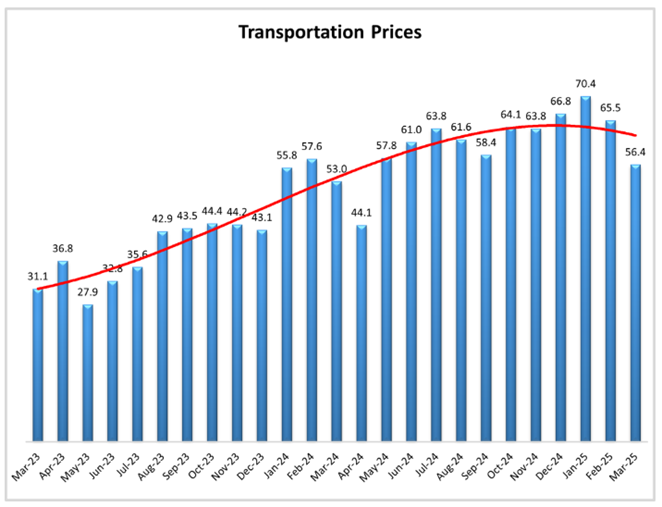
March 2025 Logistics Managers’ Index – LOGISTICS MANAGERS’ INDEX
- The Transportation Prices Index dropped 9.1 points from the previous reading and recorder 56.4 in March 2025, continuing its fast retreat from the recent high registered in January.
- Despite this second consecutive large drop, the Transportation Prices Index is still 3.4 points higher than the level indicated a year ago and a total of 25.3 points higher than the level indicated two years ago.
- The future index for Transportation Prices also continues to drop, with another 16.8-point decrease from the previous reading, and now indicating 60.0.
Cass Freight & Truckload Index
Uncertainty Reigns
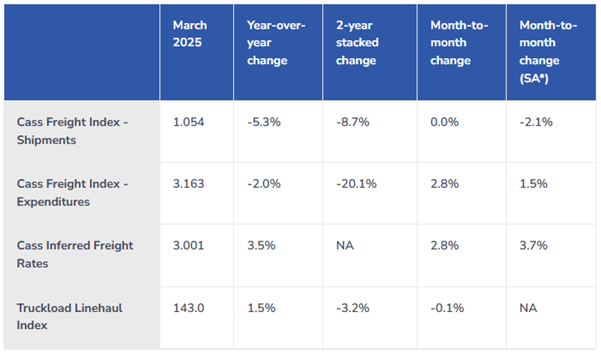
Source: Cass Information Systems, Inc.
Cass Transportation Index Report | March 2025 | Cass Information Systems
Source: Cass Information Systems, Inc.
Cass Transportation Index Report | March 2025 | Cass Information Systems
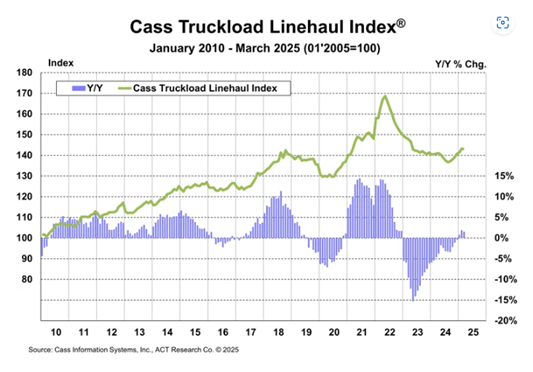
The Cass Truckload Linehaul Index is a measure of market fluctuations in per-mile truckload linehaul rates, independent of additional cost components such as fuel and accessorials.
The Cass Truckload Linehaul Index fell 0.1% m/m in March, after six straight small increases.
- The index was 4.7% above that August low in March.
- The year-over-year change slowed to a 1.5% increase in March after a 1.9% increase in February.
- This index fell 10% in 2023 and another 3% in 2024.
Truck Tonnage Index
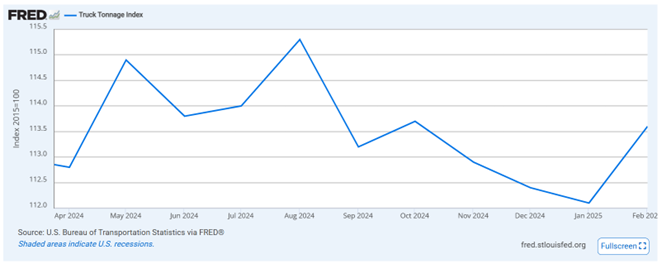
https://trucking.org/news-insights/ata-truck-tonnage-index-decreased-2-march
ATA Truck Tonnage Index Decreased 2% in March
From the American Trucking Associations (ATA) on April 23, 2025:
- Seasonally Adjusted Index: Decreased by 2.0% from February, settling at 113.4 (2015=100).
- Year-over-Year Comparison: The index fell 1.0% compared to March 2024, marking the thirteenth consecutive year-over-year decline, though this was the second smallest decrease in that period.
- Quarterly Performance: In the first quarter of 2025, the index contracted by 0.8% from the previous quarter and declined 2.4% compared to the same quarter in the previous year.
- Not Seasonally Adjusted Index: Rose to 114.4 in March, a 4.7% increase from February.
- ATA’s Commentary: Chief Economist Bob Costello noted that the March figures suggest continued softness in truck freight volumes, indicating that the truck freight recession persisted through the first quarter of 2025.
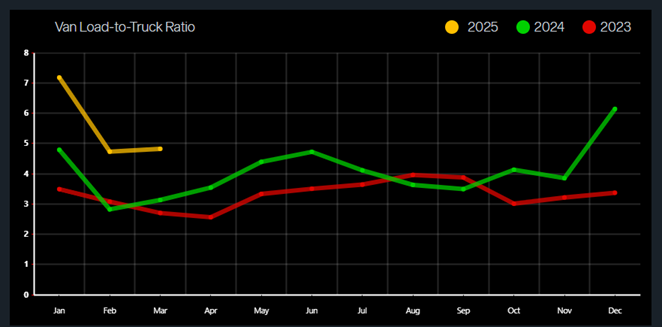
National Spot Rates
Source: DAT Analytics | https://www.dat.com/trendlines
The chart above depicts national average rates (including fuel surcharges) in the past 13 months, derived from DAT RateView.