Contents:
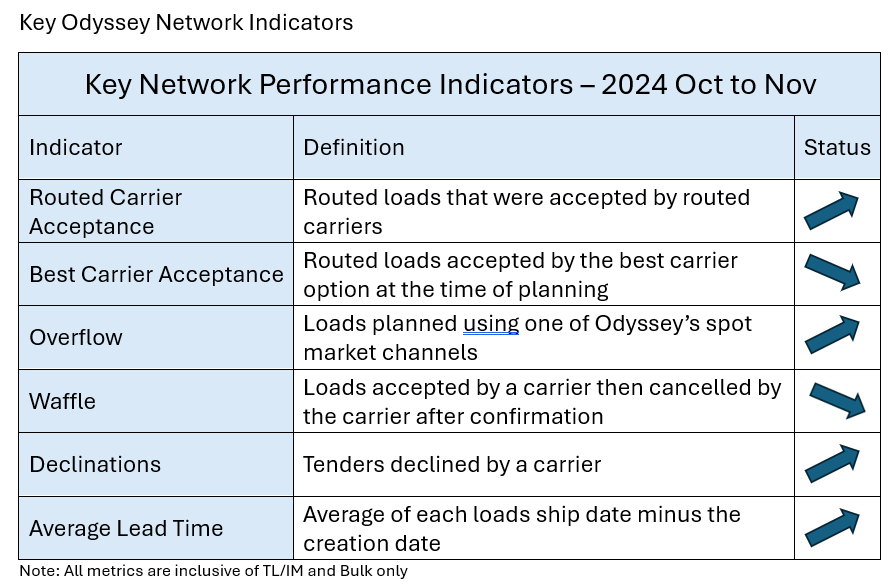
Key Odyssey Network Indicators
Shipper Actions
In today’s competitive environment, becoming a preferred shipper to carriers can help improve attaining sufficient capacity. Things that shippers offer that help reach this status can include:
Accuracy:
- Forecast for the end of month/end of quarter – plan for surges in your needs to assure coverage
- Develop order lead time – at least 5 days in advance. ask carriers for “best case” options
Specificity:
- Request delivery windows from customers…often 8 a.m. deliveries are requested when product really is not need until much later. A window of 8-10 a.m. may have a better chance of coverage.
- Spread delivery times our across the day
- Assess what your customers really need. Make sure that customer delivery requirements are up to date and accurate. Do not over-require equipment/assessorials that are not needed
Flexibility:
- Offer flexible load times
- Explore/ be open to mode options including intermodal
Driver-friendliness:
- Load/unload within the normal 2 hours-time is money to drivers
- Provide creature comforts (clean restrooms, rest areas, free Wi-Fi, a cup of coffee, etc.)
Consistency:
- Offer consistent volume that carriers can plan against
- Reduce order changes – a new date may put coverage at risk
Efficiency:
- Maximize payload on trucks
- Utilize trailer drop yards at high volume origins when possible
- Prioritize loading/unloading trucks quickly at facilities
Promptness:
- Pay carriers within their contracted freight terms- cash flow is vital to carriers
Economic Update
GDP Change
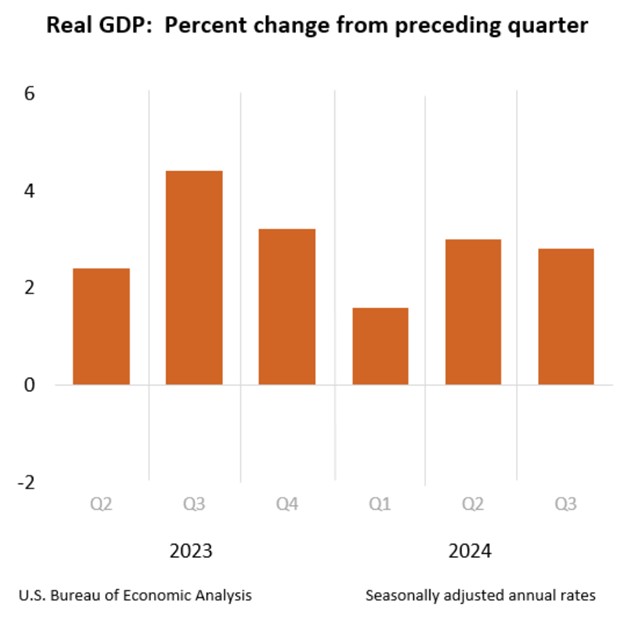
- Real gross domestic product (GDP) increased at an annual rate of 2.8 percent in the third quarter of 2024, according to the “second” estimate released by the U.S. Bureau of Economic Analysis. In the second quarter, real GDP increased 3.0 percent.
- The increase in real GDP primarily reflected increases in consumer spending, exports, federal government spending, and nonresidential fixed investment. Imports, which are a subtraction in the calculation of GDP, increased.
- Compared to the second quarter, the deceleration in real GDP in the third quarter primarily reflected a downturn in private inventory investment and a larger decrease in residential fixed investment. These movements were partly offset by accelerations in exports, consumer spending, and federal government spending. Imports accelerated.
Inflation / CPI
https://www.bls.gov/charts/consumer-price-index/consumer-price-index-by-category.htm
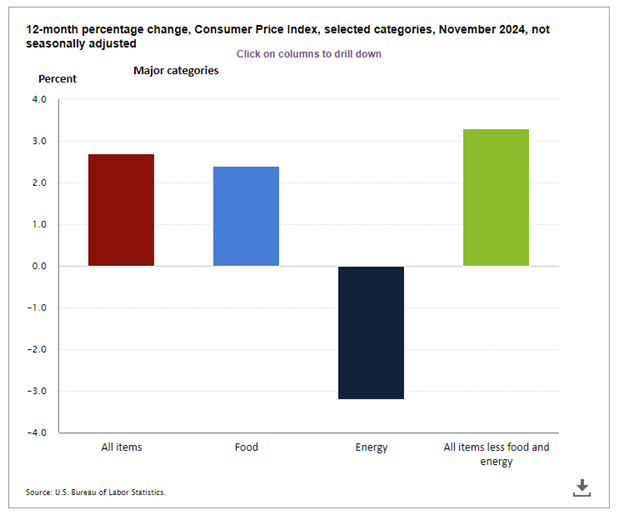
- The all items index rose 2.7 percent for the 12 months ending November, after rising 2.6 percent over the 12 months ending October. The all items less food and energy index rose 3.3 percent over the last 12 months. The energy index decreased 3.2 percent for the 12 months ending November. The food index increased 2.4 percent over the last year.
- The Consumer Price Index for All Urban Consumers (CPI-U) increased 0.3 percent on a seasonally adjusted basis in November, after rising 0.2 percent in each of the previous 4 months, the U.S. Bureau of Labor Statistics reported today. Over the last 12 months, the all items index increased 2.7 percent before seasonal adjustment.
- The index for all items less food and energy rose 0.3 percent in November, as it did in each of the previous 3 months. Indexes that increased in November include shelter, used cars and trucks, household furnishings and operations, medical care, new vehicles, and recreation. The index for communication was among the few major indexes that decreased over the month.
Unemployment
Source: U.S. Bureau of Labor Statistics
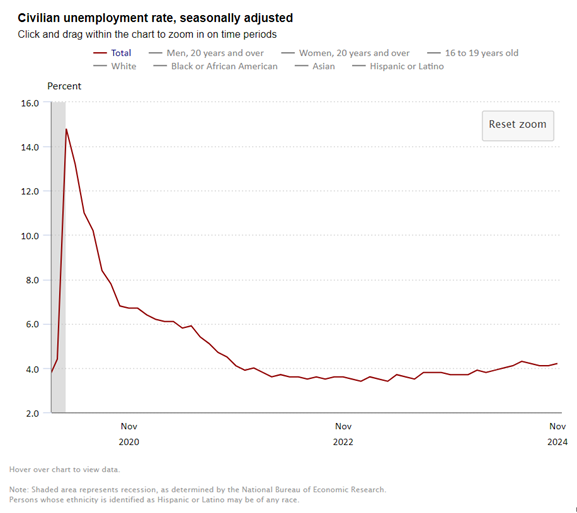
- Total nonfarm payroll employment rose by 227,000 in November, and the unemployment rate changed little at 4.2 percent, the U.S. Bureau of Labor Statistics reported today.
- Employment trended up in health care, leisure and hospitality, government, and social assistance. Retail trade lost jobs.
- This news release presents statistics from two monthly surveys.
- The household survey measures labor force status, including unemployment, by demographic characteristics.
- The establishment survey measures nonfarm employment, hours, and earnings by industry.
Household Survey Data
- Both the unemployment rate, at 4.2 percent, and the number of unemployed people, at 7.1 million, changed little in November. These measures are higher than a year earlier, when the jobless rate was 3.7 percent, and the number of unemployed people was 6.3 million.
- The number of long-term unemployed (those jobless for 27 weeks or more) was little changed at 1.7 million in November. This measure is up from 1.2 million a year earlier. In November, the long-term unemployed accounted for 23.2 percent of all unemployed people.
- The labor force participation rate, at 62.5 percent, changed little in November and has remained in a narrow range of 62.5 percent to 62.7 percent since December 2023. The employment-population ratio, at 59.8 percent, also changed little over the month but is down by 0.6 percentage point over the year.
- The number of people not in the labor force who currently want a job, at 5.5 million, changed little in November. These individuals were not counted as unemployed because they were not actively looking for work during the 4 weeks preceding the survey or were unavailable to take a job.
Establishment Survey Data
- Total nonfarm payroll employment rose by 227,000 in November, following little change in the prior month (+36,000). Over the month, Employment increased in transportation equipment manufacturing, reflecting the return of workers who were on strike.
- Employment increased by 32,000 in transportation equipment manufacturing in November, reflecting the return of workers who were on strike. Retail trade lost 28,000 jobs in November, after showing little net employment change over the prior 12 months.
- In November, employment declined in general merchandise retailers (-15,000), while electronics and appliance retailers added jobs (+4,000).
- Employment showed little or no change over the month in other major industries, including construction; wholesale trade; transportation and warehousing; and other services.
- In November, average hourly earnings for all employees on private nonfarm payrolls rose by 13 cents, or 0.4 percent, to $35.61. Over the past 12 months, average hourly earnings have increased by 4.0 percent. In November, average hourly earnings of private-sector production and nonsupervisory employees rose by 9 cents, or 0.3 percent, to $30.57.
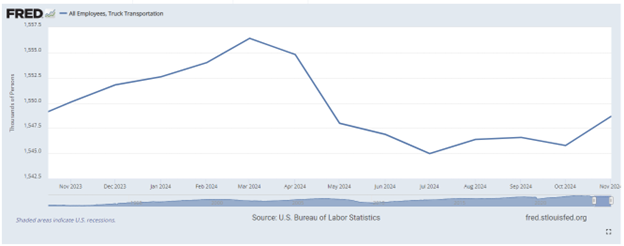
U.S. Truck Transportation Employment
https://fred.stlouisfed.org/series/CEU4348400001
Truck employment basically held steady
- At 1.563M in November compared to 1.561M in October, on a non-seasonally adjusted basis
- And only slightly below the 1.565M persons employed in November 2023
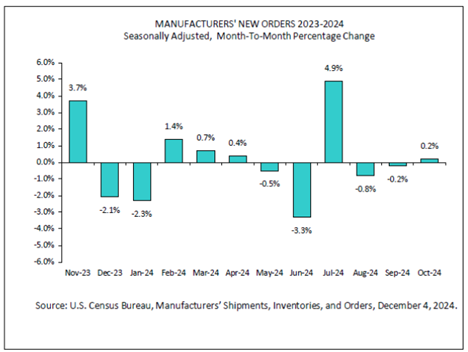
Manufactured Goods – New Orders
https://www.census.gov/manufacturing/m3/current/index.html
- New orders for manufactured goods in October, up following two consecutive monthly decreases, increased $1.1 billion or 0.2 percent to $586.7 billion. This followed a 0.2 percent September decrease.
- Shipments, down three consecutive months, decreased $1.2 billion or 0.2 percent to $585.4 billion. This followed a 0.4 percent September decrease.
- Unfilled orders, up fifty of the last fifty-one months, increased $6.1 billion or 0.4 percent to $1,398.8 billion. This followed a 0.3 percent September increase.
- The unfilled orders-to-shipments ratio was 7.03, up from 6.97 in September. Inventories, down two consecutive months, decreased $0.4 billion or 0.1 percent to $856.8 billion. This followed a 0.3 percent September decrease.
- The inventories-to-shipments ratio was 1.46, unchanged from September.
Transportation Update
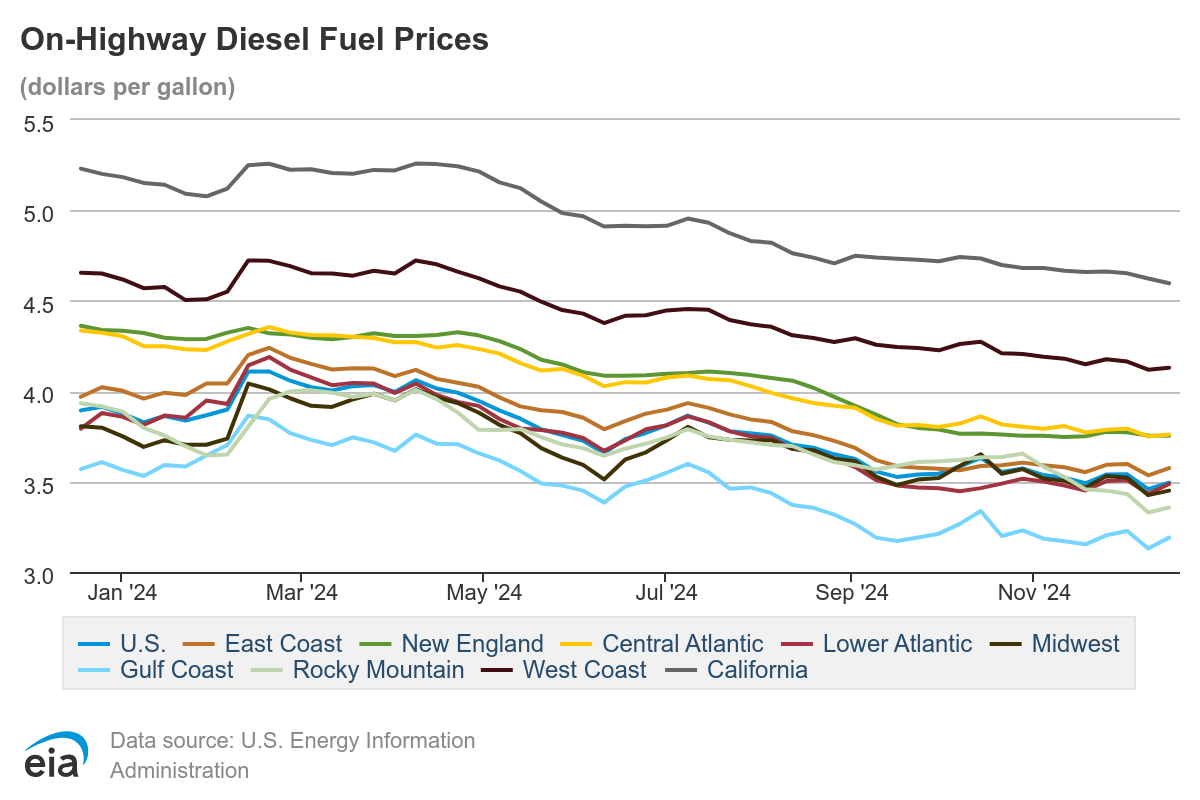
Fuel
https://www.eia.gov/petroleum/gasdiesel/?os=frefapp
The national average price of diesel for the week of 11/25 stood at $3.54 per gallon, a decrease of 3 cents from four weeks prior in October.
Transportation Capacity
https://www.the-lmi.com/october-2024-logistics-managers-index.html
Source: CSCMP LMI
- The Transportation Capacity Index registered 50.8 in October 2024. This constitutes a small increase of .8 percentage points from last month’s reading. As such, the Transportation Capacity index manages to stay (barely) above the critical threshold.
- The future Transportation Capacity index is also up slightly, now at 45.7 and continuing to indicate expectations of slight contraction in Transportation Capacity over the next 12 months.
Transportation Prices
https://www.the-lmi.com/october-2024-logistics-managers-index.html
Source: CSCMP LMI
- The Transportation Prices Index indicates 64.1 in October 2024, which corresponds to a jump of 5.7 points from the previous month. With this jump, the downward trend is broken, and the Transportation Prices index reaches its highest level in two years.
- The future index for Transportation Prices also increased 1 point and is now at 81.0. As such, the index continues to indicate strong expectations of higher Transportation Prices in the next 12 months.
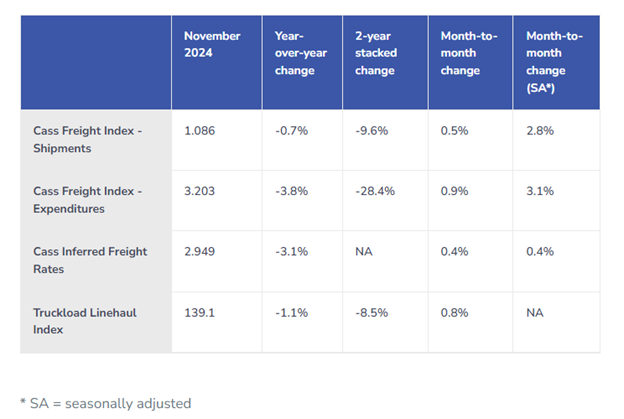
Cass Truckload Index
Source: Cass Information Systems, Inc.
https://www.cassinfo.com/freight-audit-payment/cass-transportation-indexes/november-2024
Source: Cass Information Systems, Inc.
https://www.cassinfo.com/freight-audit-payment/cass-transportation-indexes/truckload-linehaul-index
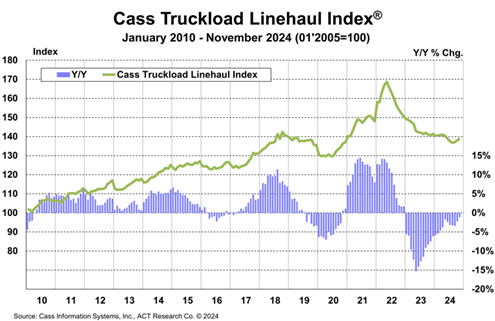
The Cass Truckload Linehaul Index is a measure of market fluctuations in per-mile truckload linehaul rates, independent of additional cost components such as fuel and accessorials.
The Cass Truckload Linehaul Index
- decreased 1.1 percent year-over-year in November to 139.1
- rose 0.8 percent month-to-month from October (non-seasonally adjusted)
The Shipments Index
- Declined by 0.7% in November year-over-year, the narrowest decline in 21 months
- Jumped 2.8% month-to-month since October on a seasonally adjusted basis
- Ongoing economic growth and slowing private fleet capacity additions are helping to narrow y/y declines, but the normal seasonal pattern would have the index down about 3% y/y in December.
- After rising 13% in 2021 and 0.6% in 2022, the index declined 5.5% in 2023 and is on track for a 4% decline in 2024
ATA Truck Tonnage Index
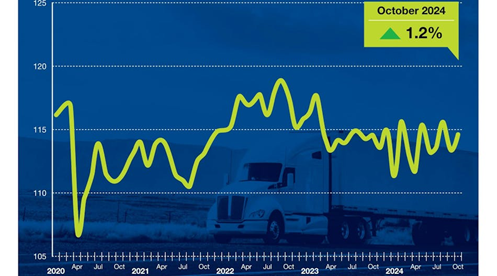
Source: Bult Transporter | In calculating the index, 100 represents 2015. ATA’s For-Hire Truck Tonnage Index is dominated by contract freight as opposed to spot market freight.
https://www.bulktransporter.com/fleet-management/article/55246029/ata-truck-tonnage-rises-in-october
- “Since hitting a low in January of this year, tonnage is up a total of 3%, plus the index is up sequentially in three of the last four months. No doubt the freight market has improved,” ATA’s chief economist reports.
- Trucking activity in the US rose modestly in October, marking the third increase since July.
- In October, the Truck Tonnage Index equaled 114.6 compared with 113.3 in September. The index equaled the reading from the same month last year, ATA reported.
- The non-seasonally adjusted index, which calculates raw changes in tonnage hauled, equaled 121.3 in October, 8.6% above September.
- The seasonally adjusted increase follows a decline in September.
- Trucking serves as a barometer of the U.S. economy, representing 72.6% of tonnage carried by all modes of domestic freight transportation, including manufactured and retail goods.
Van Load-Truckload Ratio
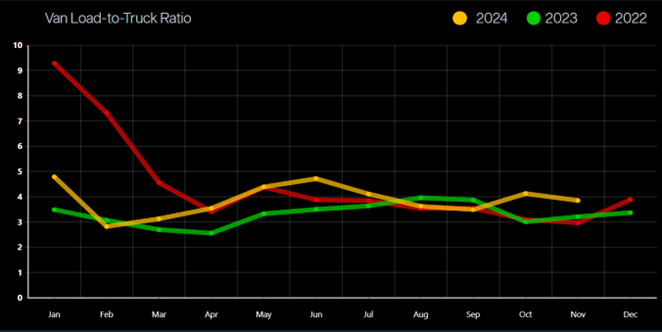
Source: DAT Analytics | https://www.dat.com/trendlines/van/demand-and-capacity
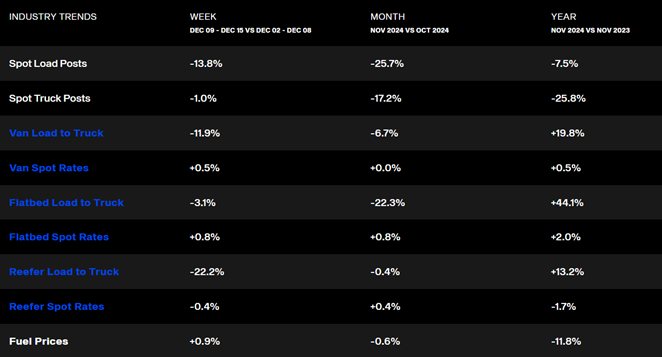
National Spot Rates
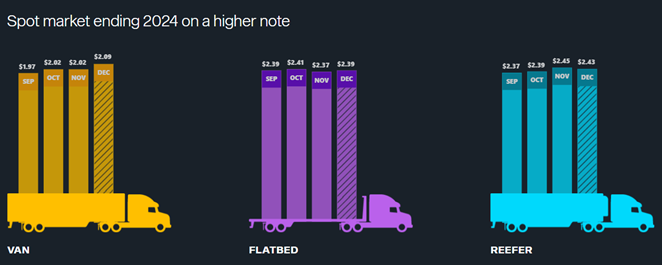
Source: DAT Analytics | https://www.dat.com/trendlines
The chart above depicts national average rates (including fuel surcharges) in the past 13 months, derived from DAT RateView.