
Contents:
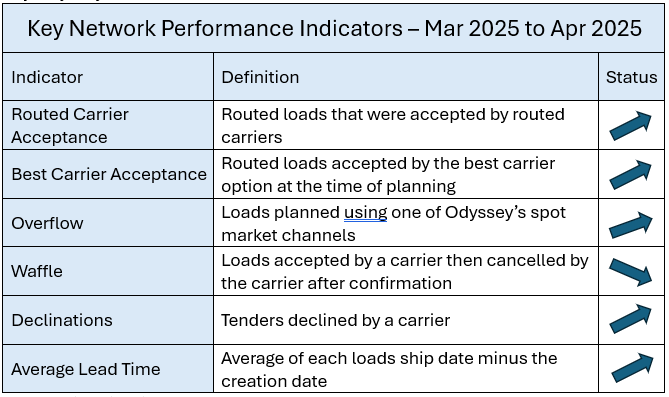
Key Odyssey Network Indicators
Shipper Actions
In today’s competitive environment, becoming a preferred shipper to carriers can help improve attaining sufficient capacity. Things that shippers offer that help reach this status can include:
Accuracy:
Forecast for the end of month/end of quarter – plan for surges in your needs to ensure coverage
Develop order lead time – at least 5 days in advance. ask carriers for “best case” options
Specificity:
Request delivery windows from customers…often 8 a.m. deliveries are requested when product really is not need until much later. A window of 8-10 a.m. may have a better chance of coverage.
Spread delivery times across the day
Assess what your customers really need. Make sure that customer delivery requirements are up to date and accurate. Do not require equipment/assessorials that are not needed
Flexibility:
- Offer flexible load times
- Explore/ be open to mode options including intermodal
Driver-friendliness:
- Load/unload within the normal 2 hours-time is money to drivers
- Provide creature comforts (clean restrooms, rest areas, free Wi-Fi, a cup of coffee, etc.)
Consistency:
- Offer consistent volume that carriers can plan against
- Reduce order changes – a new date may put coverage at risk
Efficiency:
- Maximize payload on trucks
- Utilize trailer drop yards at high volume origins when possible
- Prioritize loading/unloading trucks quickly at facilities
Promptness:
- Pay carriers within their contracted freight terms- cash flow is vital to carriers
Economic Update
GDP Change
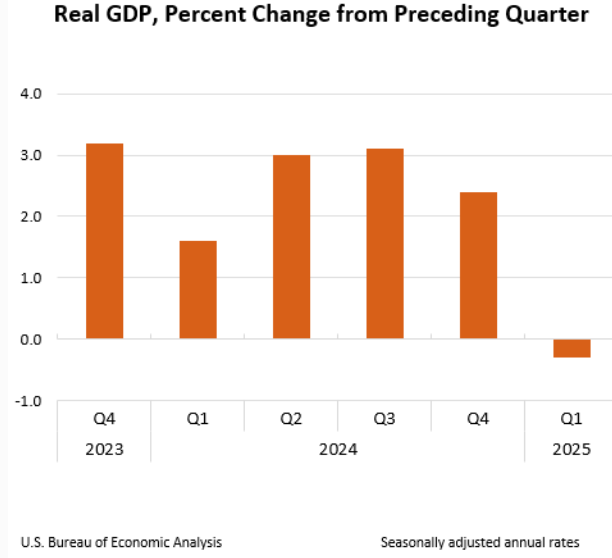
Gross Domestic Product | U.S. Bureau of Economic Analysis (BEA)
- Real gross domestic product (GDP) decreased at an annual rate of 0.3 percent in the first quarter of 2025 (January, February, and March), according to the advance estimate released by the U.S. Bureau of Economic Analysis. In the fourth quarter of 2024, real GDP increased 2.4 percent.
- The decrease in real GDP in the first quarter primarily reflected an increase in imports, which are a subtraction in the calculation of GDP, and a decrease in government spending.
- These movements were partly offset by increases in investment, consumer spending, and exports.
Unemployment

https://www.bls.gov/charts/employment-situation/civilian-unemployment-rate.htm
- Total non-farm payroll employment increased by 177,000 in April, and the unemployment rate was unchanged at 4.2 percent, the U.S. Bureau of Labor Statistics reported today.
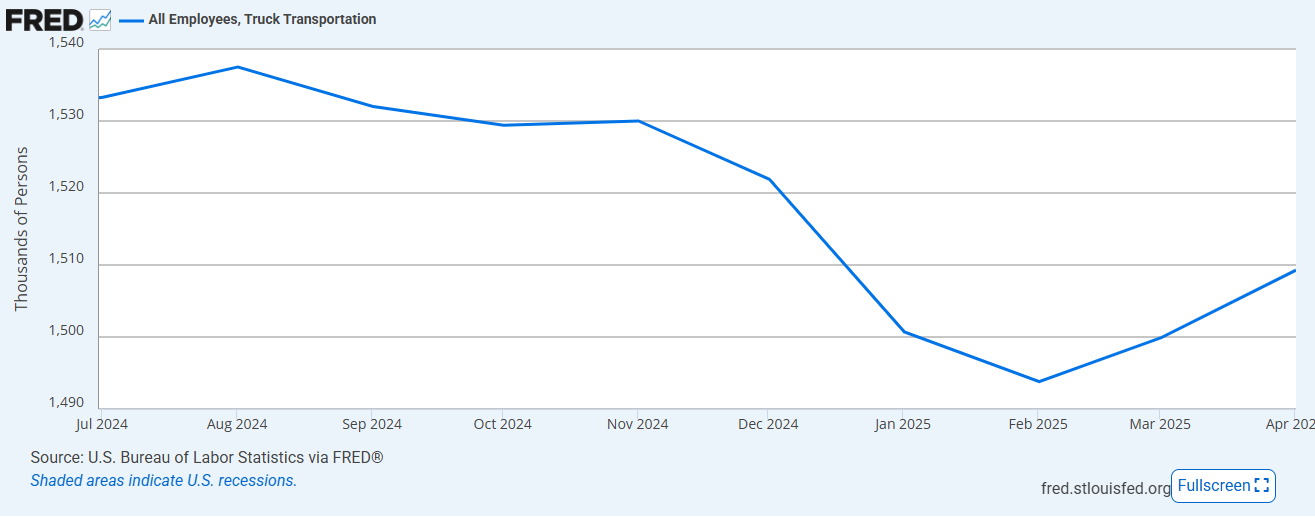
- Employment continued to trend up in health care, transportation and warehousing, financial activities, and social assistance. Federal government employment declined.
- This news release presents statistics from two monthly surveys.
- The household survey measures labor force status, including unemployment, by demographic characteristics.
- The establishment survey measures non-farm employment, hours, and earnings by industry.
Household Survey Data
- The unemployment rate was unchanged at 4.2 percent in April and has remained in a narrow range of 4.0 percent to 4.2 percent since May 2024.
- The number of unemployed people, at 7.2 million, changed little in April.
- In April, the number of long-term unemployed (those jobless for 27 weeks or more) increased by 179,000 to 1.7 million. The long-term unemployed accounted for 23.5 percent of all unemployed people.
- Both the labor force participation rate, at 62.6 percent, and the employment-population ratio, at 60.0 percent, changed little in April. These measures have shown little change over the year.
- The number of people employed part time for economic reasons, at 4.7 million, changed little in April. These individuals would have preferred full-time employment but were working part-time because their hours had been reduced or they were unable to find full-time jobs.
Establishment Survey Data
- Transportation and warehousing had added an average of 12,000 jobs per month over the prior 12 months.
- In April, financial activities employment continued to trend up (+14,000). The industry has added 103,000 jobs since its employment trough in April 2024.
- Employment in social assistance continued its upward trend in April (+8,000) but at a slower pace than the average monthly gain over the prior 12 months (+20,000).
- Within government, federal government employment declined by 9,000 in April and is down by 26,000 since January. (Employees on paid leave or receiving ongoing severance pay are counted as employed in the establishment survey.)
- Employment showed little or no change over the month in other major industries, including mining, quarrying, and oil and gas extraction; construction; manufacturing; wholesale trade; retail trade; information; professional and business services; leisure and hospitality; and other services.
- In April, average hourly earnings for all employees on private non-farm payrolls rose by 6 cents, or 0.2 percent, to $36.06. Over the past 12 months, average hourly earnings have increased by 3.8 percent. In April, average hourly earnings of private-sector production and nonsupervisory employees rose by 10 cents, or 0.3 percent, to $31.06.
U.S. Truck Transportation Employment
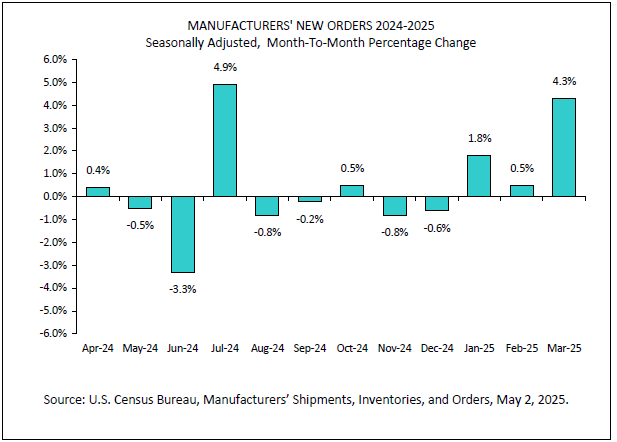
Manufactured Goods – New Orders
https://www.census.gov/manufacturing/m3/current/index.html
Monthly Full Report on Manufacturers’ Shipments, Inventories, & Orders
(Released May 2, 2025)
- New orders for manufactured goods in March, up three consecutive months, increased $25.7 billion or 4.3 percent to $618.8 billion, the U.S. Census Bureau reported today. This followed a 0.5 percent February increase.
- Shipments, down following four consecutive monthly increases, decreased $0.6 billion or 0.1 percent to $596.2 billion. This followed a 0.7 percent February increase.
- Unfilled orders, up seven of the last eight months, increased $2.1 billion or 0.1 percent to $1,402.7 billion. This followed a 0.2 percent January increase.
- Unfilled orders, up eight of the last nine months, increased $27.6 billion or 2.0 percent to $1,429.4 billion. This followed a 0.1 percent February increase. The unfilled orders-to-shipments ratio was 6.98, up from 6.81 in February. Inventories, up five consecutive months, increased $0.7 billion or 0.1 percent to $865.3 billion. This followed a 0.1 percent February increase.
- The inventories-to-shipments ratio was 1.45, unchanged from February.
Transportation Update
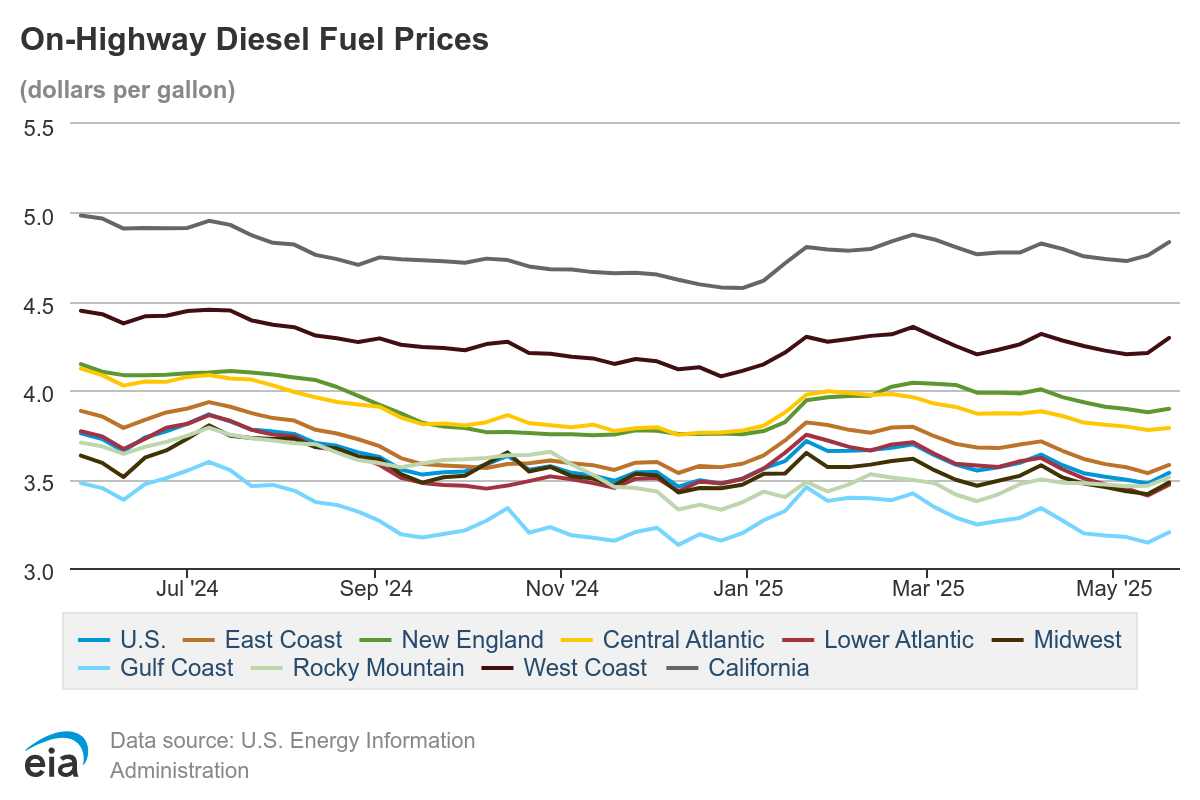
Fuel
https://www.eia.gov/petroleum/gasdiesel/?os=frefapp
The national average price of diesel for the week of April 30 stood at $3.51 per gallon, a decrease of 8 cents from four weeks prior at the end of March and down $0.433 from a year ago.
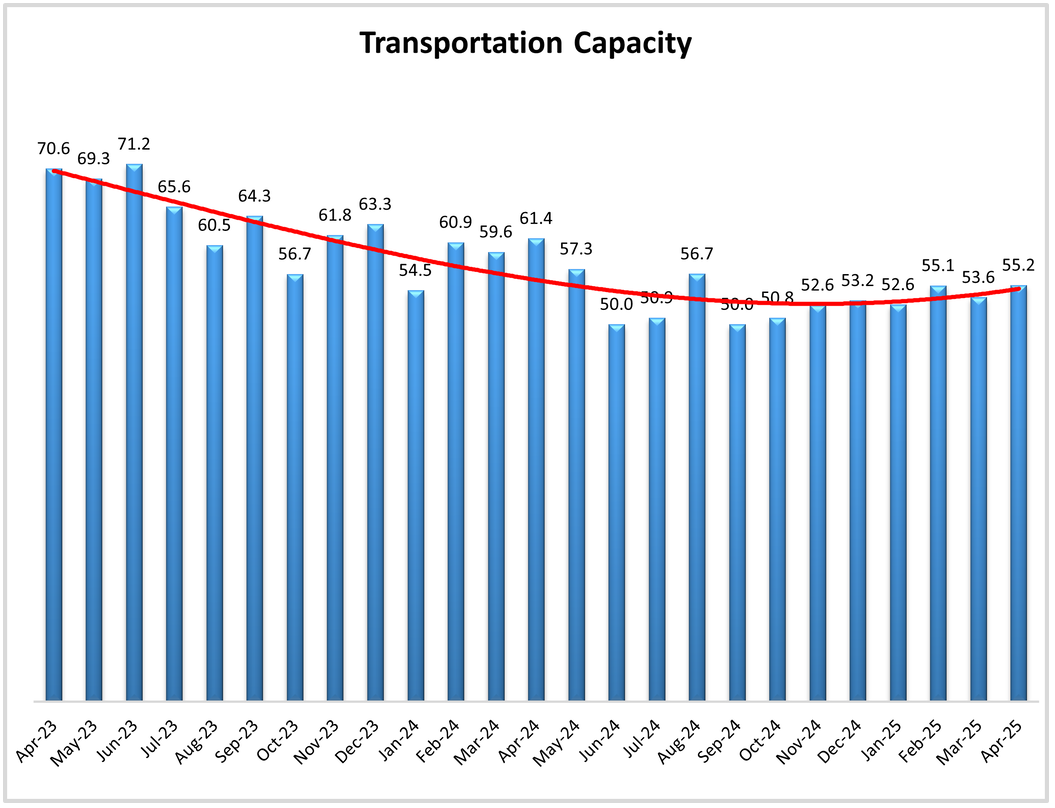
Transportation Capacity
April 2025 Logistics Managers’ Index – LOGISTICS MANAGERS’ INDEX
- The Transportation Capacity Index seesawed back to 55.2 in April 2025.
- There is no significant difference between Upstream and downstream, with Upstream Transportation Capacity index at 53.8 and the downstream index at 59.6. As such, the slight expansion trend in Transportation Capacity remains present both Upstream and Downstream, across supply chains.
- The future Transportation Capacity index also ticked slightly higher, and it is now at 53.4,continuing to indicate expectations of a slightly increasing Transportation Capacity over the next 12 months. While the Upstream index is at 53.3, the Downstream Transportation Capacity index is at 55.8, both indicating expectations of slight expansion over the next year.
Transportation Prices
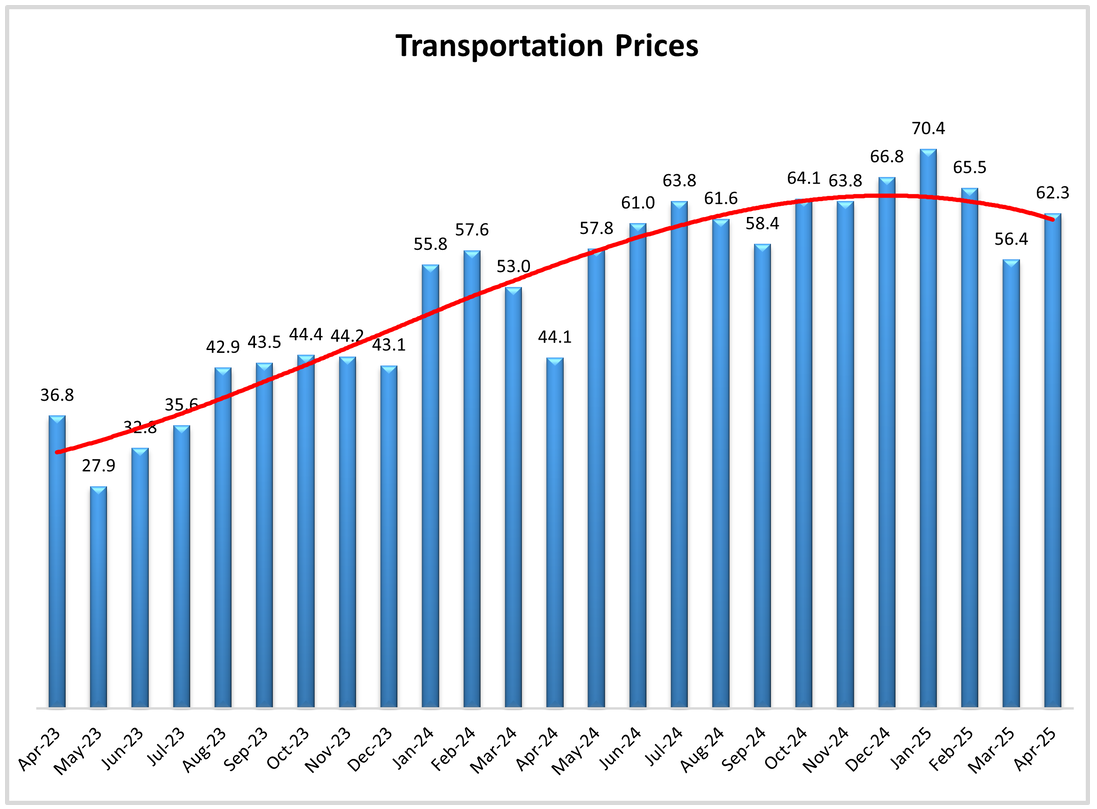
April 2025 Logistics Managers’ Index – LOGISTICS MANAGERS’ INDEX
- The Transportation Prices Index popped 5.9 points from the previous reading and recorder 62.3 in April 2025.
- This level is way above recent Transportation Price readings, indicating levels 18.2 points higher than a year ago and 25.5 points higher than two years ago. The upstream Transportation Prices Index is at 58.3, and the Downstream index is at 71.2, and the difference is statistically significant, indicating that the price increase is mainly driven by the Downstream transportation.
- The future index for transportation prices also increased from last month, indicating 12.3 points higher, at 72.3. The Downstream future Transportation Prices index is at 75.0 while the Upstream Transportation Prices index is at 70.7, but the difference is not statistically significant.
Cass Freight & Truckload Index
Uncertainty Reigns
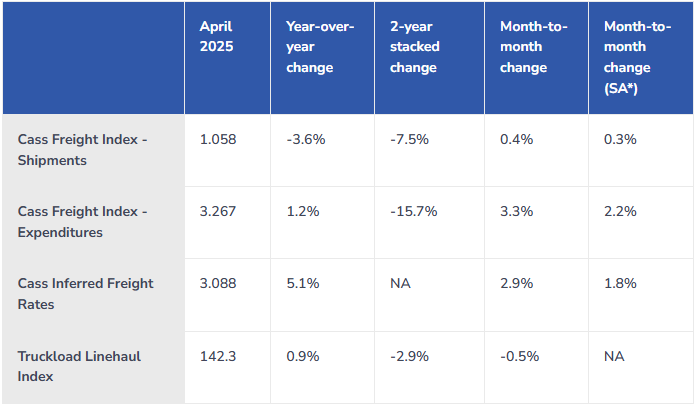
Source: Cass Information Systems, Inc.
Cass Transportation Index Report | April 2025 | Cass Information Systems
Source: Cass Information Systems, Inc.
Cass Transportation Index Report | March 2025 | Cass Information Systems
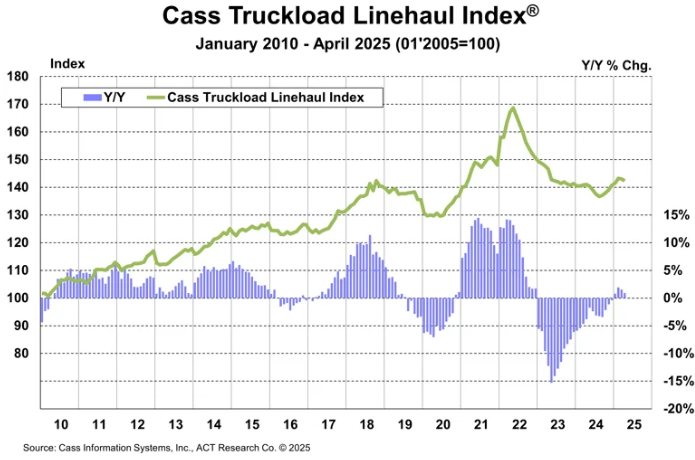
The Cass Truckload Linehaul Index is a measure of market fluctuations in per-mile truckload linehaul rates, independent of additional cost components such as fuel and accessorials.
The Cass Truckload Linehaul Index fell 0.5% m/m in April, after a 0.1% decline in March.
- The y/y increase slowed to 0.9% in April from 1.5% in March, as rate momentum in the truckload market stalled as pre-tariff shipping was not enough to tighten the market balance in a seasonally soft April.
- This index fell 10% in 2023 and another 3% in 2024. Where it will go in 2025 is a big question.
Truck Tonnage Index
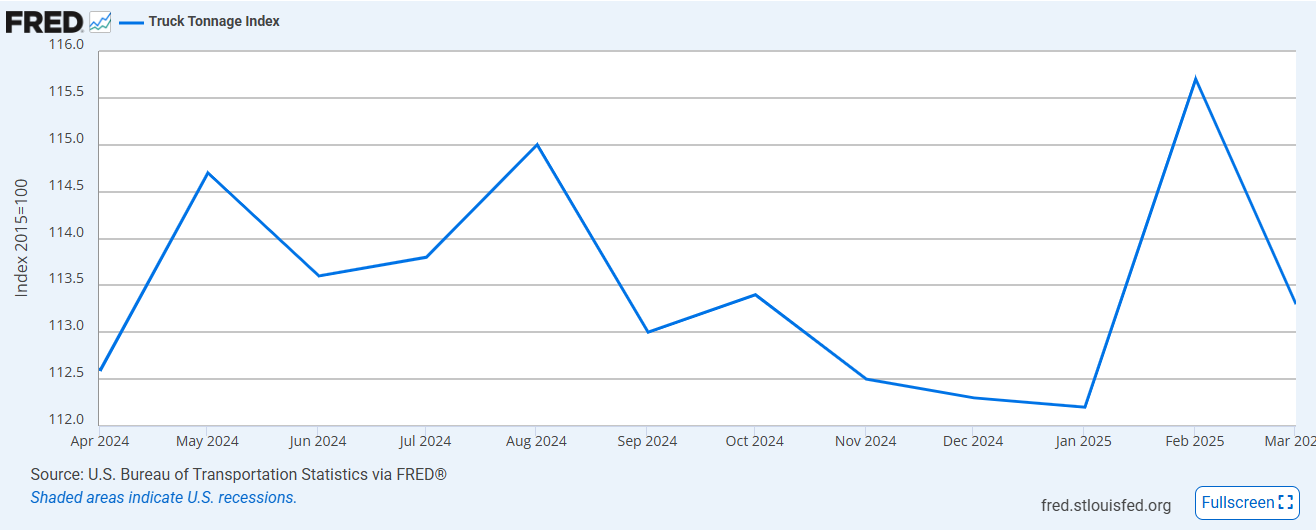
https://trucking.org/news-insights/ata-truck-tonnage-index-declined-03-april
ATA Truck Tonnage Index Declined 0.3% in April
From the American Trucking Associations (ATA) on May 20, 2025:
- In April, the ATA advanced seasonally adjusted For-Hire Truck Tonnage Index equaled 113.0, down from 113.3 in March. The index, which is based on 2015 as 100, was up 0.1% from the same month last year, the fourth straight year-over-year increase, albeit the smallest increase over this period.
- The not seasonally adjusted index, which calculates raw changes in tonnage hauled, equaled 112.0 in April, 2.2% below March’s reading of 114.6.
- Trucking serves as a barometer of the U.S. economy, representing 72.7% of tonnage carried by all modes of domestic freight transportation, including manufactured and retail goods. Trucks hauled 11.27 billion tons of freight in 2024. Motor carriers collected $906 billion, or 76.9% of total revenue earned by all transport modes.
- Both indices are dominated by contract freight, as opposed to traditional spot market freight. The tonnage index is calculated on surveys from its membership and has been doing so since the 1970s. This is a preliminary figure and subject to change in the final report issued around the 5th day of each month. The report includes month-to-month and year-over-year results, relevant economic comparisons, and key financial indicators.
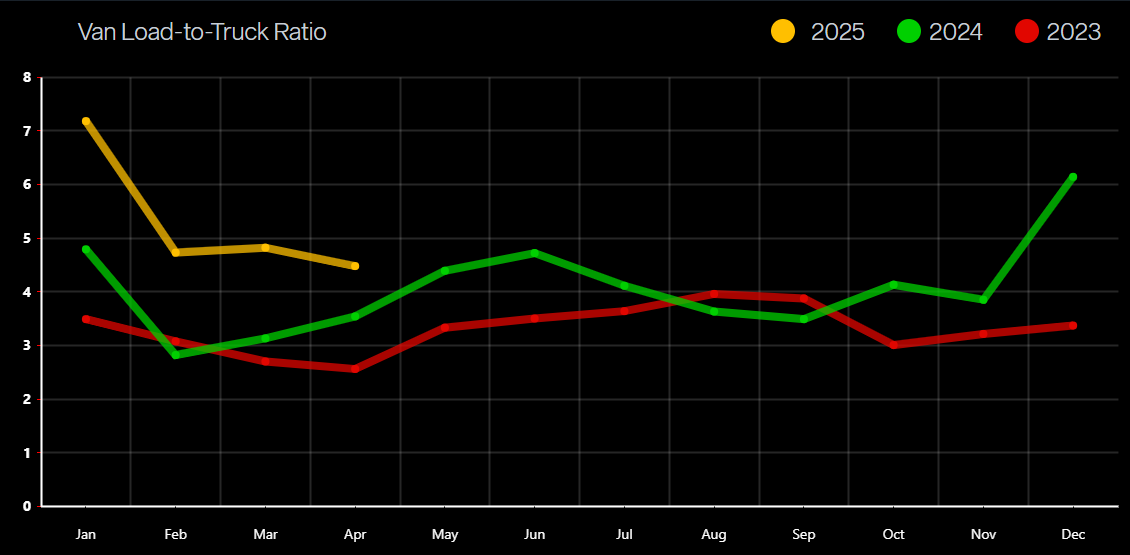
National Spot Rates
Source: DAT Analytics | https://www.dat.com/trendlines
The chart above depicts national average rates (including fuel surcharges) in the past 13 months, derived from DAT RateView.