Transportation Update
LMI® at 45.6
- Growth is INCREASING AT AN INCREASING RATE for: Warehousing Capacity
- Growth is INCREASING AT AN DECREASING RATE for: Inventory Costs, Warehousing Utilization, Warehousing Prices, and Transportation Capacity
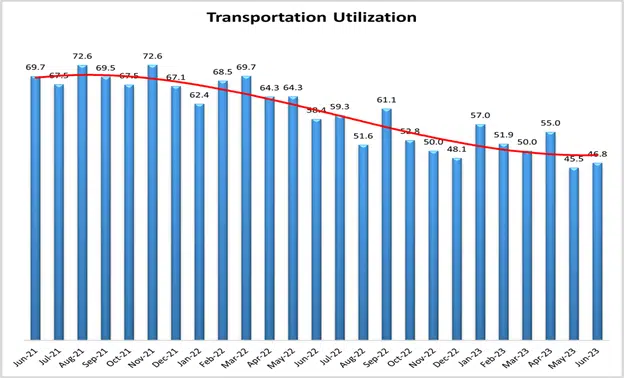
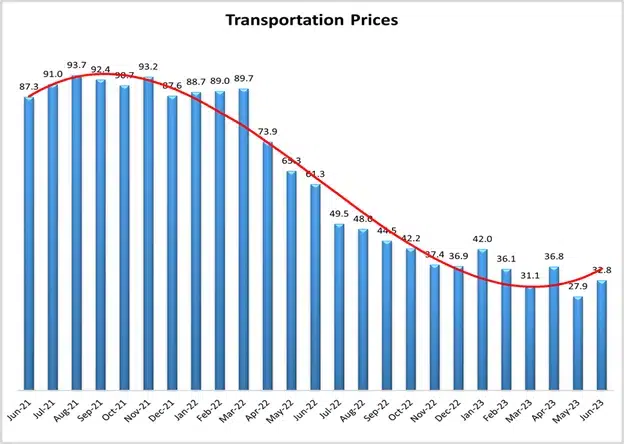
- Inventory Levels, Transportation Utilization, and Transportation Prices ARE DECREASING
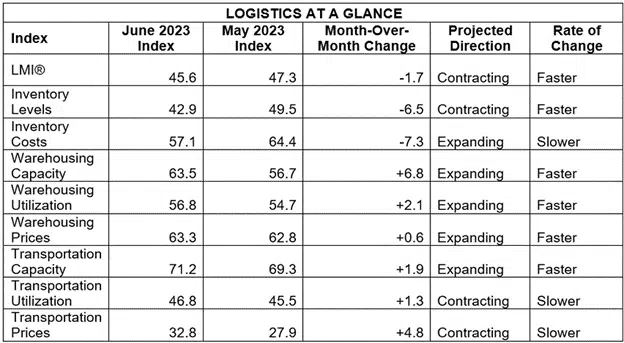
For the second time in a row, the Logistics Managers’ Index registers as contracting – coming in at 45.6. This is the fourth consecutive month that the index has reached a new all-time low. Our inventory metrics are at the forefront of this decline. Inventory Levels are contracting (-6.5) at 42.9, which is the second fastest rate in the history of the index and the growth rate for Inventory Costs is down (-7.3) to 57.1. The dip in inventories has led to an increase in Warehousing Capacity (+6.8) and Transportation Capacity (+1.9), both of which contribute to a decrease in the overall metric. Transportation Utilization and Transportation Prices are contracting but at reduced rates from what we saw in May.
Results Overview
The LMI score is a combination of eight unique components that make up the logistics industry, including: inventory levels and costs, warehousing capacity, utilization, and prices, and transportation capacity, utilization, and prices. The LMI is calculated using a diffusion index, in which any reading above 50.0 indicates that logistics is expanding; a reading below 50.0 is indicative of a shrinking logistics industry. The latest results of the LMI summarize the responses of supply chain professionals collected in June 2023.
When taken as a whole, Q2 economic data was strong in the U.S. – if not in the freight sector. For instance, new home sales are up, the unemployment rate is down, and Q1 GDP growth has been revised up to 2% growth with Q2 growth predicted to be around 1.7%. Much of this has been spurred by consumer spending, which was up at 4.2% in Q1 – the highest positive rate of change since the end of lockdowns in mid-2021. This is at least partially reflected on the continually higher rates of expansion (or at least slower rates of contraction) that we are often seeing from our Downstream relative to Upstream respondents.
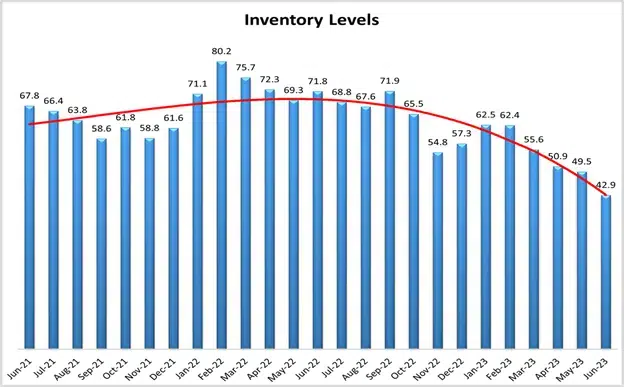
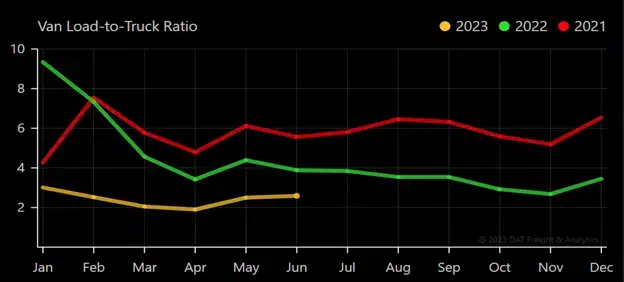
Inventory metrics were the big movers in June. Inventory levels continued their downward movement, dropping (-6.5) to 42.9, which is the second-lowest reading in the history of this metric. Seasonality would suggest that this value should come up soon, but there are some signals that might not happen. Traditionally we see consumers move from bulkier goods that may require financing (i.e. lawn furniture) in the summer towards smaller goods (i.e. back-to-school items, clothing, and toys) during the back half of the year. Smaller goods have been moving faster throughout the year – as evidenced by the stronger inventory and transportation numbers we have seen for most of 2021. While this could theoretically lead to more volume in Q3 and Q4, there does not appear to be a large glut of holiday inventory on the way. The Chinese manufacturing PMI read in at 49.0 in June. This marks three consecutive months of contraction in what is often the ramp up for back-to-school and holiday production. The overall Chinese PMI is positive at 53.2 but is the weakest reading of 2023 – casting doubt on any significant increases in Chinese economic production. Container imports are down from the highs of 2021 and 2022, but according to analysis by Michigan State professor (and friend of the index) Jason Miller, the volumes we are seeing now are up 7.4% from 2019 – exactly in line with the predicted level of growth that would have occurred have the COVID disruptions never happened. Due to the contraction (which some would call “right-sizing”) of inventories, Inventory Cost growth dipped in June, slowing (-7.3) to 57.1 which is a noticeably slower rate of contraction.
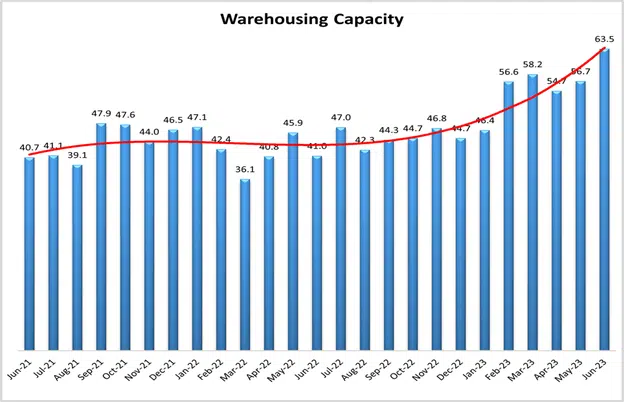
The reduction in inventories is having a clear impact on the warehousing sector. Warehousing Capacity expanded (+6.8) to a growth rate of 63.5. This is the fastest rate of expansion for this metric in the history of the index, and only the second time it has read in the 60’s (the other occurrence was February 2020 as Chinese imports began to dry up due to lockdowns). Despite this abundance of capacity Warehousing Utilization increased its rate of growth, increasing (+2.1) to 56.8 in June. Despite the reduction of inventories, some firms are clearly betting that a move back towards seasonal spending on goods and an increase in ecommerce will lead to more demand down the road.
The freight market remains challenging. After a one-month reprieve in the 60’s Transportation Capacity is back up (+1.9) to 71.2 and above 70.0 – where it has been for almost all of 2023. Despite the excess capacity and low prices, the exits from the freight market that we would have expected to see have not yet materialized. However, if Yellow Corp. bankruptcy were to happen at the third-largest LTL carrier in the U.S., capacity might begin to tighten, and spot-market prices may begin to stabilize. Capacity could also be impacted by a potential strike at UPS. If the sides do not reach an agreement, it is likely that The Teamsters will strike when their contract expires at the end of July. While the decrease in available trucking capacity could be a boon to some carriers, UPS need only to look at the problems currently being faced by Yellow Corp and their ongoing labor and restructuring issues (oh which labor is admittedly only one element of their financial issues) to see what the consequences of not reaching a deal could be.
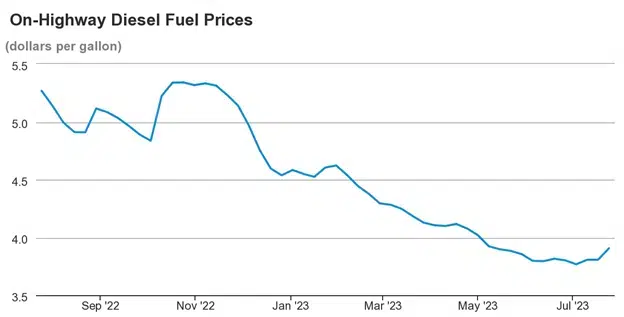
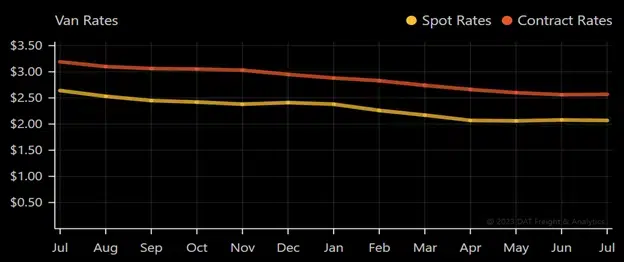
Unsurprising, that the glut of capacity has led to a continued contraction in Transportation Utilization (+1.3) which reads in at 46.8 which is its second consecutive month of contraction – although this month is a slower rate of contraction relative to what we observed in May. Contraction may be slowing due to the national tender rejection rate hovering between 2.5-3.2% through the start of summer, with some expected upward movement as we approach the Fourth of July holiday. Interestingly, we do see some spot rates increasing, particularly for outbound freight from large markets such as Phoenix or Memphis. Spot markets still linger well behind contract rates – potentially explaining some of the discrepancies we will see below between large and small carriers. Transportation Prices continue to decrease rapidly at 32.8, but at least that reading is 4.8 points higher than May’s record contraction rate of 27.9. Beyond excess capacity, it is likely that the falling price of diesel, which is down to $3.80 per gallon in the last week of June – $1.98 cheaper than this time a year ago has contributed to continually falling prices as well.
*This is an abbreviated summary of the report. For the full report, click here.
The index scores for each of the eight components of the Logistics Managers’ Index, as well as the overall index score, are presented in the table below. The overall LMI is contracting at its fastest rate ever. Similar to May, three of the eight sub-metrics are contracting this month. In the reverse of what we saw last month, four of the five metrics that are expanding are doing so at an increased rate. Only Inventory Costs are expanding at a slower rate than what we saw in May.
National Fuel Average
DAT Freight Summary
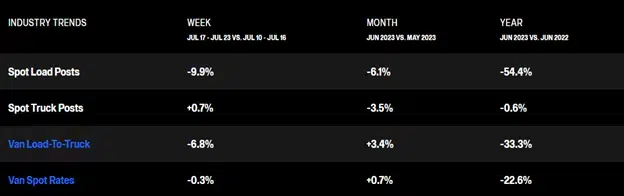
Truckload Market
The outbound tender shipping demand request rose 4.75% week over week.
- This is still a 9.36% reduction year over year.
Outbound tender rejection rates saw a 3.23% increase week over week.
- This increase did not result in an upward adjustment in spot rates.
- As a result, contracted prices continue to remain flat.
Most supply chain analysts see a muted peak season for the upcoming Fall season.
- Planned imports from China are down as companies continue to work through inventory bloat.
- As a result, truckload markets are anticipated to stay soft until Q2 2024.
LTL Market Update
After 99 years of operations, Yellow has ceased operations and it is expected that they will file for bankruptcy. This comes after almost a year’s worth of negotiations between Yellow and the Teamsters. Yellow stated that it needed to consolidate operations to be able to restructure its $1.3 billion debt. The Teamsters refused to concede, citing that the changes create utility positions where drivers would have to work the docks at some terminals as well as handle other responsibilities. They also stated it would subvert bargaining and violate the grievance process.
The broader LTL market will be able to absorb the freight with minimal impact.
- Odyssey Clients that depend on Yellow as a primary carrier should not expect any significant disruptions.
- Clients should expect to see higher rates if they wish to keep the same levels of service.
UPS and the Teamsters have reached a tentative labor agreement to avoid a strike.
Details of this agreement include:
- A raise of $2.75/hr in 2023.
- An additional $7.50/hr raise by the end of the contract.
- Part-time workers will have an immediate raise to a minimum of $21/hr effective immediately.
- They will also receive a 48% average total wage increase over the next 5 years.
- Heat safety in delivery vehicles for all purchases after Jan. 1, 2024.
- Additional hiring of 7,500 Union jobs and filling 22,500 open positions.
- MLK Day will now be a full holiday for Teamster drivers.
- Seasonal work will now be limited to 5 weeks in November and December