Transportation Update
LMI® at 47.3
- Growth is INCREASING AT AN INCREASING RATE for: Warehousing Capacity
- Growth is INCREASING AT AN DECREASING RATE for: Inventory Costs, Warehousing Utilization, Warehousing Prices, and Transportation Capacity
- Inventory Levels, Transportation Utilization, and Transportation Prices ARE DECREASING
For the third consecutive month the Logistics Managers’ Index has reached a new all-time low and for the first time in its 6.5-year history it has moved into contraction territory, reading in at 47.3 in May – down 3.6-points from April’s reading of 50.9. The biggest factor behind this drop is the continued softening of the freight market. Transportation Utilization was down (-9.5) to 45.5, indicating contraction and signaling that shippers are using less of the available space than they did a month ago. Relatedly, Transportation Prices are down (-8.9) to 27.9, which is the sharpest rate of contraction that has ever been observed for this metric. Taken together, the glut of available capacity has driven down utilization and prices. Reprieves are unlikely for carriers in the form of restocking inventories. Inventory Levels dropped (-1.5) to 49.5 which is the first-time inventories have been in contraction territory since February of 2020. It should be noted however that downstream retail inventories do continue to grow at a rate of 54.4, it is the upstream manufacturer and wholesaler inventories that are contracting (46.7) and bringing the overall number down. Warehousing Prices are still growing at a rate of 62.8 but are down (7.0) from last month and at their lowest level since June 2020. These factors are likely to continue to come down as more long-term contracts signed during 2020 and 2021 continue to come off the books.
The logistics industry’s LMI declined to 47.3 in May, down (-3.7) from April’s reading of 50.9. This is the first time in the 82 months of the LMI that the overall index has contracted. The rate of contraction was stronger for Upstream firms than for their Downstream counterparts at a rate of 45.3 to 48.2. While contraction is taking root throughout the supply chain, it continues to be sharper for the upstream players such as wholesalers, manufacturers, and the B2B carriers that connect them – likely because those entities are more impacted by uncertainty regarding interest rates. We also see that contraction was sharper in late May (44.1) than it was in the first half of the month (49.4), meaning that logistics activity declined more rapidly later in the month.
Source: CSCMP
DAT Freight Summary:
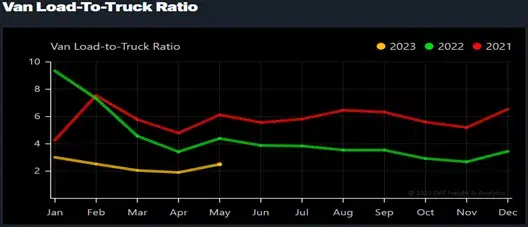
- Van Load to truck ratios increased by 5.6% week over week.
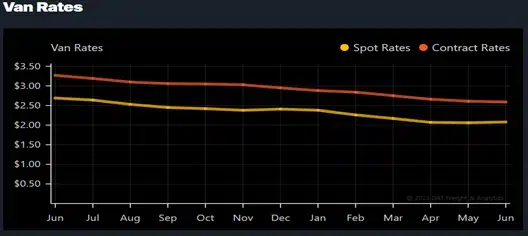
- Spot Rates increased 0.3% week over week.
- Spot Load Posts decreased by 1.0% week over week.
Fuel
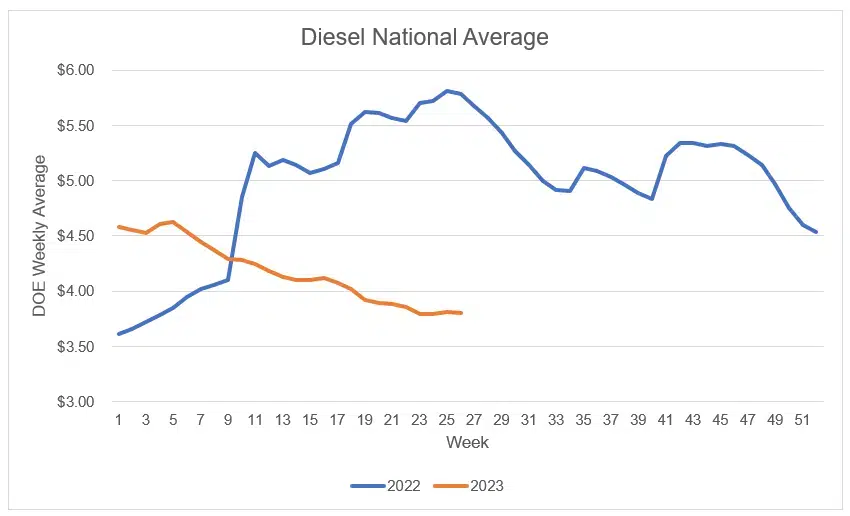
The Diesel national average stands at $3.801 for the week of 6/26.
- Fuel prices have declined for 20 out of the past 22 weeks.
- Fuel prices are down $0.821 since this year’s high of $4.622 on 1/30.
- Fuel prices are down $1.982 YoY.
- Bulk Fuel is currently at 26.5%.
Forecasts from the EIA
- Global oil markets.Following the OPEC+ announcement on June 4 to extend crude oil production cuts through 2024, the EIA forecast global oil inventories to fall slightly in each of the next five quarters. They expect these draws will put some upward pressure on crude oil prices, notably in late-2023 and early-2024. The EIA forecasts Brent crude oil spot price will average $79 per barrel (b) in the second half of 2023 (2H23) and $84/b in 2024.
- U.S. economy. The EIA forecast assumes U.S. GDP growth of 1.3% in 2023 and 1.0% in 2024, which is down from last month’s forecast of 1.6% in 2023 and 1.8% in 2024, based on the S&P Global macroeconomic model for the U.S. economy and the EIA energy price forecasts. Lower GDP growth reduces total U.S. energy consumption in both years compared with last month’s forecast.
| Notable Forecast Changes
The current STEO forecast was released June 6. The previous STEO forecast was released May 9. | 2023 | 2024 |
| Natural gas price at Henry hub (current forecast) (dollars per million British thermal units) | $2.66 | $3.42 |
| Previous Forecast | $2.91 | $3.72 |
| Percentage Change | -8.8% | -8.0% |
| Dry natural gas production (current forecast) (billion cubic feet per day) | 102.7 | 103.0 |
| Previous Forecast | 101.1 | 101.2 |
| Percentage Change | 1.6% | 1.8% |
| Brent spot average (current forecast) (dollars per barrel) | $79.54 | $83.51 |
| Previous Forecast | $78.65 | $74.47 |
| Percentage Change | 1.1% | 12.1% |
| OPEC crude oil production (current forecast) (million barrels per day) | 33.5 | 33.8 |
| Previous Forecast | 33.8 | 34.4 |
| Percentage Change | -0.7% | -1.8% |
| U.S. crude oil production (current forecast) (million barrels per day) | 12.6 | 12.8 |
| Previous Forecast | 12.5 | 12.7 |
| Percentage Change | 0.6% | 0.7% |
| Real gross domestic product (current forecast) (percentage) | 1.3% | 1.0% |
| Previous Forecast | 1.6% | 1.8% |
| Percentage Change | -0.3 | -0.7 |
| Manufacturing production index (current forecast) (percentage) | -1.2% | 0.0% |
| Previous Forecast | -0.6% | -1.6% |
| Percentage Change | -0.6 | -1.6 |
The truckload (and LTL) market appears to be nearing its bottom.
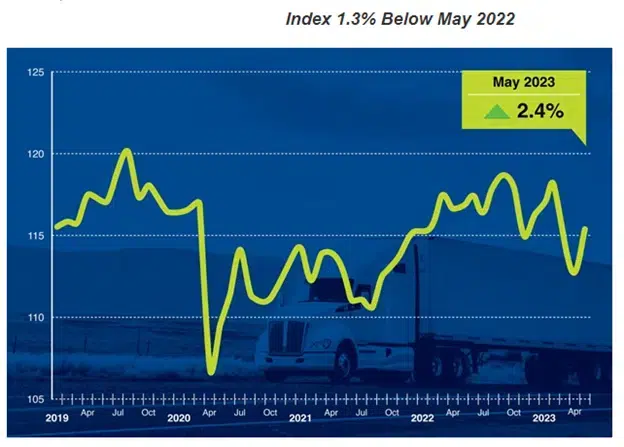
- American Trucking Associations’ advanced seasonally adjusted For-Hire Truck Tonnage Index rose 2.4% in May after decreasing 1.7% in April. In May, the index equaled 115.4 (2015=100) compared with 112.7 in April.
- Compared with May 2022, the seasonally adjusted index decreased 1.3%, which was the third straight year-over-year decrease. In April, the index was down 3.4% from a year earlier.
- Tonnage continues to contract from year earlier levels as retail sales remain soft, manufacturing production continues to fall from a year ago, and housing starts contract from 2022 levels.
According to Jason Miller, interim chairperson for the Department of Supply Chain Management at Michigan State University, “It increasingly looks like the deflationary environment in the over-the-road dry van truckload sector as well as the less-than-truckload sector is winding down. In other words, the worst of the rate declines has passed…spot rates appear to have hit bottom, and consistent with this, the rate the PPI is declining is slowing. This makes sense since the PPI is primarily capturing contract freight. Assuming spot rates are at bottom, I would expect the PPI to cease declining by August.”
LTL
Yellow has sued the Teamsters Union for a breach of contract.
- Situation:
- Yellow states that they could run out of cash as soon as mid-July.
- Creditors could force the company into liquidation at that time.
- Yellow reported a 100.8% operating ratio in Q1 2023.
- Yellow has asked to defer health care and pension contributions for the next two months.
- Yellow said the union doesn’t have the authority to stop a proposed modernization change in operations to create “One Yellow.”
- The union claims that the changes would require too many utility positions, requiring drivers to work on the docks.
- The union will honor the current contract which expires at the end of March 2024.
- How Odyssey is prepared in the event of disrupted service from Yellow:
- Yellow accounts for less than 6% of all Odyssey LTL Freight Under Management.
- Yellow plays a backup role on a majority of the route guides where they are present.
- On every origin/lane where Yellow is routed as primary carrier there is a reputable carrier also on the route guide which would be willing to take on the volume.
ABF Freight Systems reached a tentative agreement with the Teamsters that goes into effect July 1.
- A $3.50 hourly wage increase (plus 8.75 cents per mile) for all regular employees.
- A 75-cent increase (plus 1.875 cents per mile) in each of the following four years of the deal.
- Cost-of-living increases.
- Martin Luther King Day is now a new additional paid holiday.
- Qualifying employees receive two additional paid holidays
Old Dominion continues to see a tonnage decrease.
- The LTL carrier is down 14.4% year over year (YoY) in May.
- This comes off a decline of 14.5% (YoY) in April.
- These declines extrapolate into a 2% decline over Q1 2023.
- ODFL typically sees an increase of 2-3% in April and May.
- ODFL also typically sees an additional 2% increase in June.
Saia reported a tonnage decrease as well.
- Tonnage down 2% YoY in May.
- This was a 4.2% decline in shipments.
- Tonnage was down 1.1% in April YoY.
- This was a 5.7% reduction in shipments.