Transportation Update
View the full October 2023 Logistics Managers’ Index Report ®
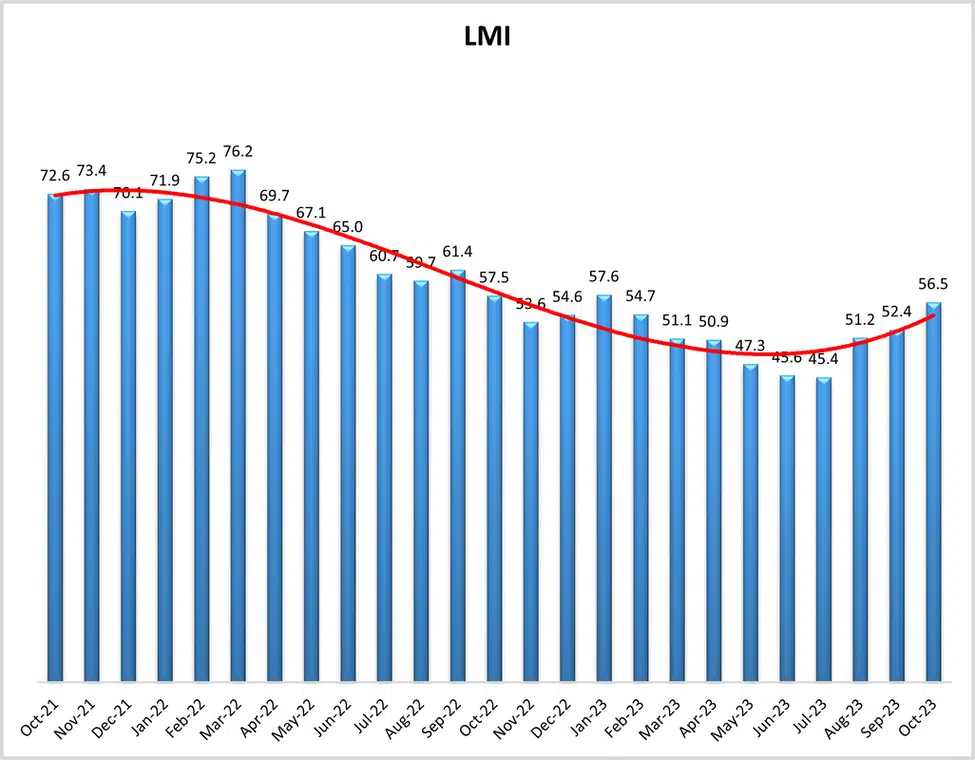
October 2023 Logistics Manager’s Index Report® LMI® at 56.5
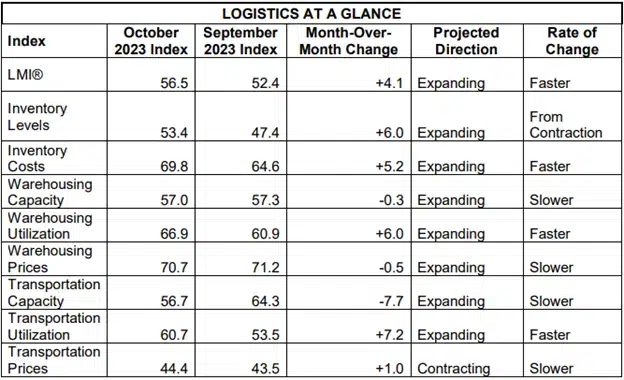
Growth is INCREASING at an INCREASING RATE for: Inventory Levels, Inventory Costs, Warehousing Utilization, Warehousing Prices, and Transportation Utilization.
Growth is INCREASING at a DECREASING RATE for: Warehousing Capacity and Transportation Capacity.
Transportation Prices are DECREASING.
The index scores for each of the eight components of the Logistics Managers’ Index, as well as the overall index score, are presented in the table below. The overall index is expanding at a slightly faster rate (+4.1) of 56.5. Seven of the eight sub-components are expanding, including Inventory Levels which moved from contraction back to expansion at a rate of 53.4. The only metric that continues to contract is Transportation Prices at 44.4
LMI ®
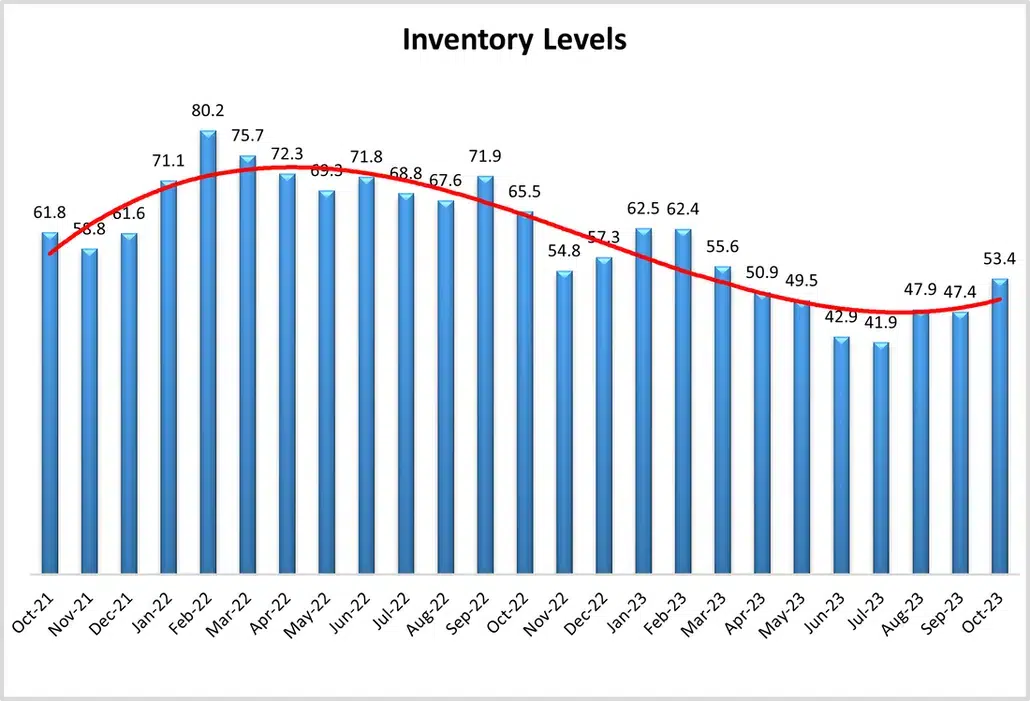
Inventory Levels
The Inventory Level value was 53.4 in October, up (+6.0) from September’s reading of 47.4. This is a marked change for Inventory Levels, which are not expanding following five consecutive months of decline. Despite the upturn, this value is 12.1 points lower than last year and 8.4 points lower than 2 years ago. This change suggests that firms have largely gotten through the excess inventories of the past 18 months and are now moving back towards the expansion we would expect at this time of the year. The rebuilding of inventory is more pronounced in certain sections of the supply chain. While both Upstream and Downstream respondents reported increases, Downstream expansion was much faster- (at a rate of 59.3 to 50.8). In a change from the last few months, we also see more growth coming from smaller firms (58.0). Smaller firms had been hesitant to increase inventories due to their more tenuous cash position, but now seem to be building goods up again, perhaps signaling a vote of confidence for the consumer economy in Q4? When asked to predict what conditions will be like 12 months from now, the average value is 55.7, up (+2.2) from September’s future prediction of 53.5. Interestingly, Upstream respondents predicted an increase of 61.3, while downstream respondents predicted a decrease of 44.4. There is a chance that this difference in expectations reflects a greater desire on the part of retailers to manage inventories more carefully.
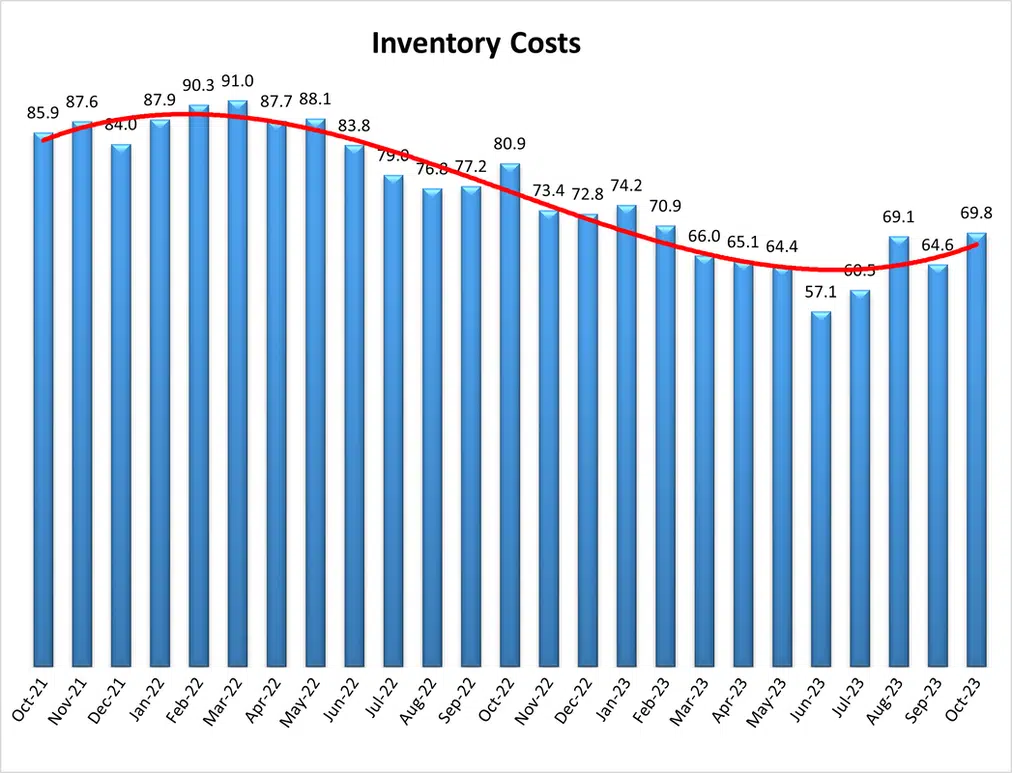
Inventory Costs
Inventory costs have increased to 69.8, the highest level since February, and are up (+5.2) from September’s reading of 64.6. These cost increases should be kept in perspective as it is 11.1 points lower than last year, and 16.1 points lower than two years ago. Upstream (69.7) and Downstream (69.2) respondents both observed very similar increases in costs. In keeping with their move to rebuild inventories, smaller firms did report Inventory Costs increasing at a faster rate than larger firms (72.4 to 65.8) in a shift from the trend of the last three months. Predictions for future Inventory Cost growth are 66.9, down (-4.5) from September’s future prediction of 71.5. Interestingly, Upstream respondents’ future predictions averaged 72.1, while Downstream respondents averaged 55.8, a more modest increase. These increases were consistent with the expected increases in inventory.
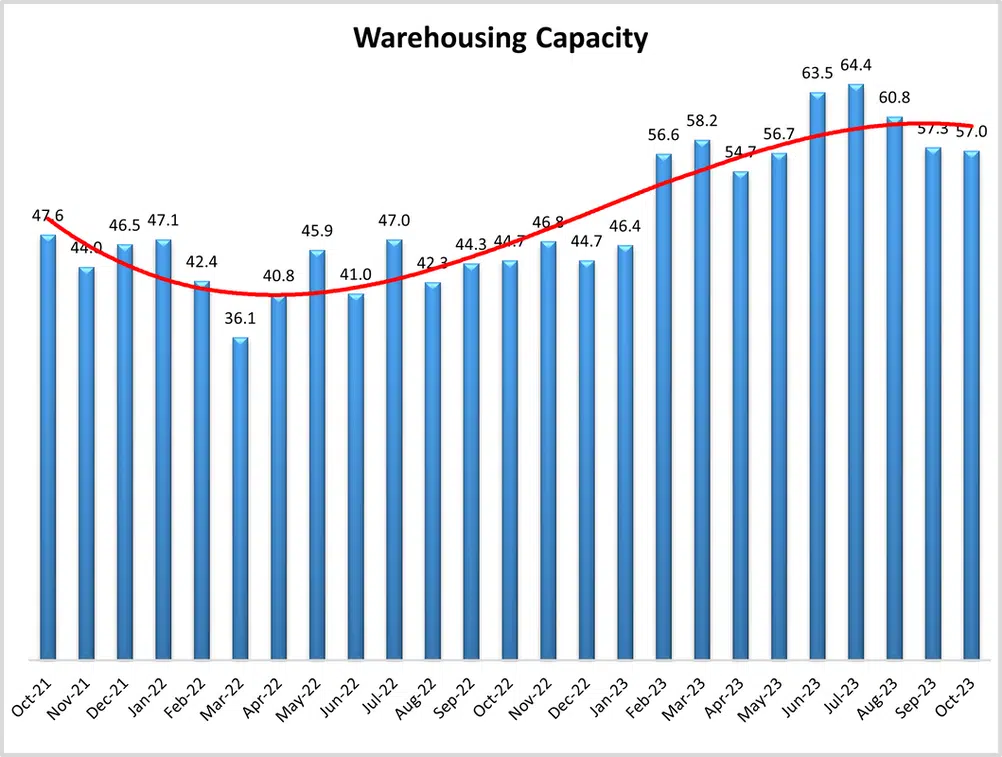
Warehousing Capacity
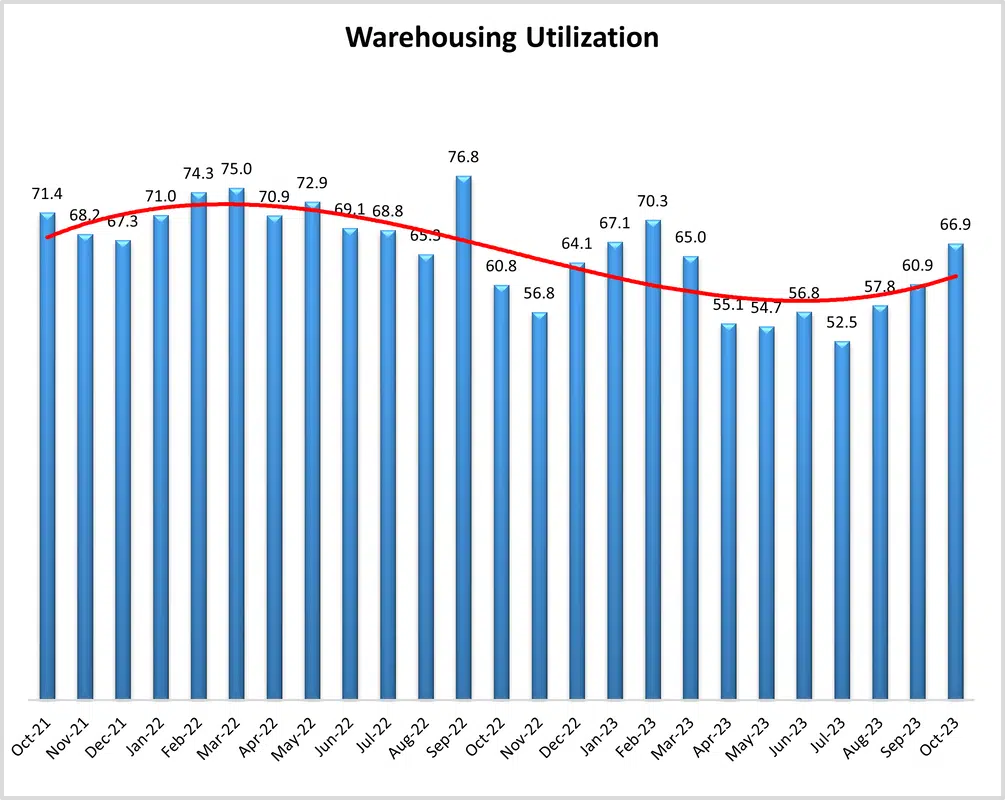
Warehousing Utilization
The Warehouse Utilization index for October 2023 registered at 66.9 points, reflecting a 6- point increase from the reading one month ago. This reading is up 6.0-points from the reading one year ago and is (interestingly) down by 3.5 percentage points from the reading two years ago. The split between Downstream (65.6) and Upstream (69.2) was not statistically significant. On this measurement, the difference between small firms (68.4) vs. large firms (64.5) was not statistically significant. In addition, future predictions remain relatively stable as the one year out Upstream (70.5) and Downstream (63.5) remain relatively similar to the current readings. Looking forward to the next 12 months, the predicted Warehousing Utilization index is 68.0, up (+3.6) from September’s future prediction of 64.4. In a reverse from last month, Upstream firms are more bullish on future utilization, predicting an expansionary rate of 70.5 – 7.0 points higher than the Downstream prediction of 63.5-point growth.
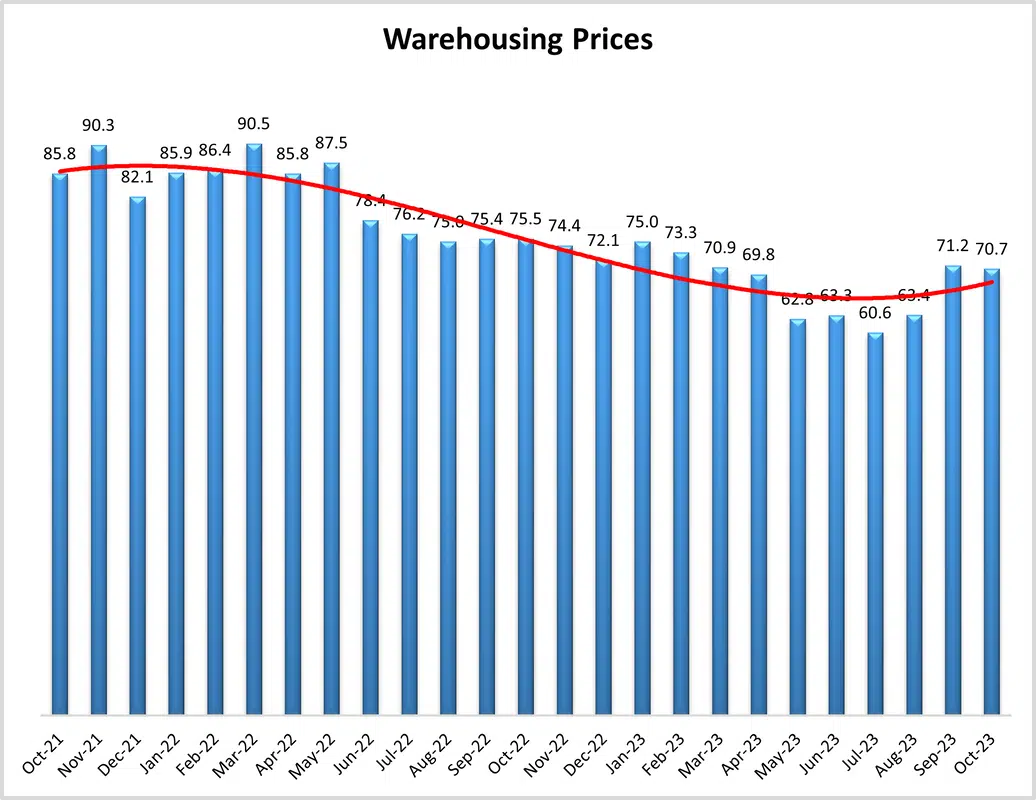
Warehousing Prices
Finally, the Warehousing Prices index for October 2023 registered at 70.7, reflecting a minimal decrease of .5 points from the reading from one month ago. By contrast, this measure is down just under 5 percentage points from the reading one year ago, and down over 15 percentage points from the reading two years ago. The split between Downstream (69.8) and Upstream (72.2) was not statistically significant. On this measurement, the difference between small firms (71.0) vs. large firms (68.9) was not statistically significant (p=.128). In addition, future predictions remain relatively stable as the one year out Upstream (71.4) and Downstream (64.0) remain relatively similar to the current readings. Future predictions suggest price growth will remain healthy as respondents are expecting prices to continue to grow at a rate of 69.0, down (-2.5) from September’s future prediction of 71.5. This suggests that firms are planning to stock up on inventory over the next year and are anticipating that the costs of doing so will be high. Upstream firms expect a significantly faster rate of price expansion at 71.4 relative to Downstream predictions of 64.0.
Transportation Capacity
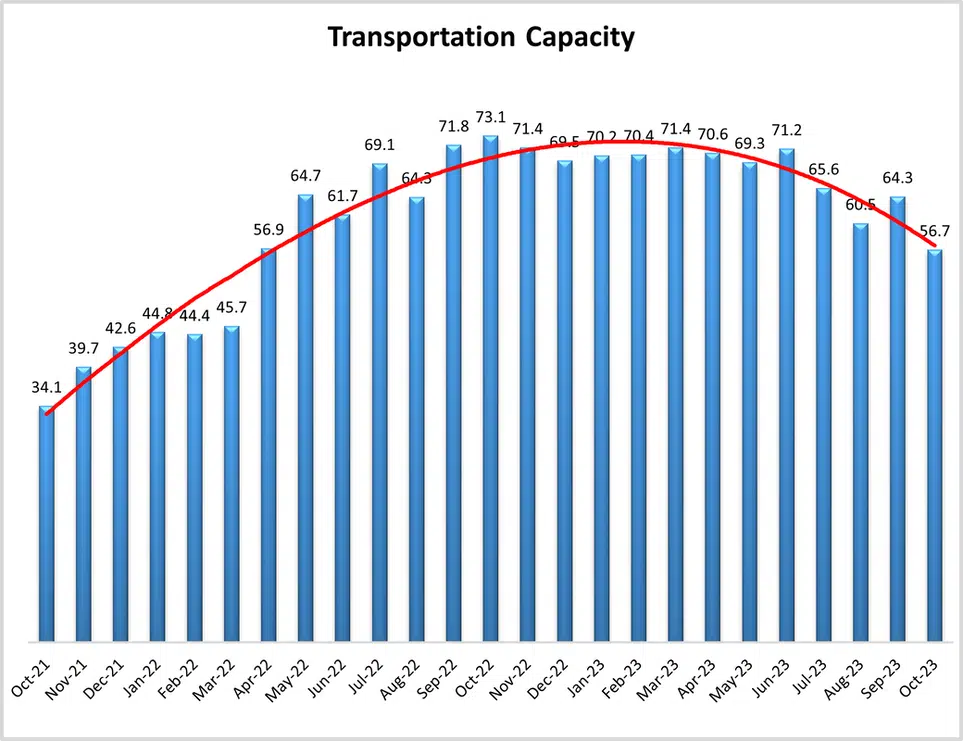
The Transportation Capacity Index registered 56.7 percent in October 2023. This constitutes a decrease of 7.6 percentage points from the September reading of 64.3. With this decrease the Transportation Capacity Index has resumed the downward trend that was experiencing for a few months. The decrease is even more significant for the Upstream Transportation Capacity index which is at 54.7, while the Downstream index is at 61.1. As such, while the Transportation Capacity index remains slightly above 50, and continues to indicate expansion, it can be concluded that the holiday season ramp up is putting increased pressures on transportation systems. The last time the Transportation Capacity Index was this low was in April 2022. The future Transportation Capacity index indicates 47.8 corresponding to a drop of 6.1 points from the previous reading, falling below 50 and now indicating expectations of a slight contraction in Transportation Capacity over the next 12 months. These expectations are relatively uniformly dispersed across the supply chains, with the Downstream future Transportation Capacity index at 48.1 while the Upstream future Transportation Capacity index indicates 47.7.
Transportation Utilization
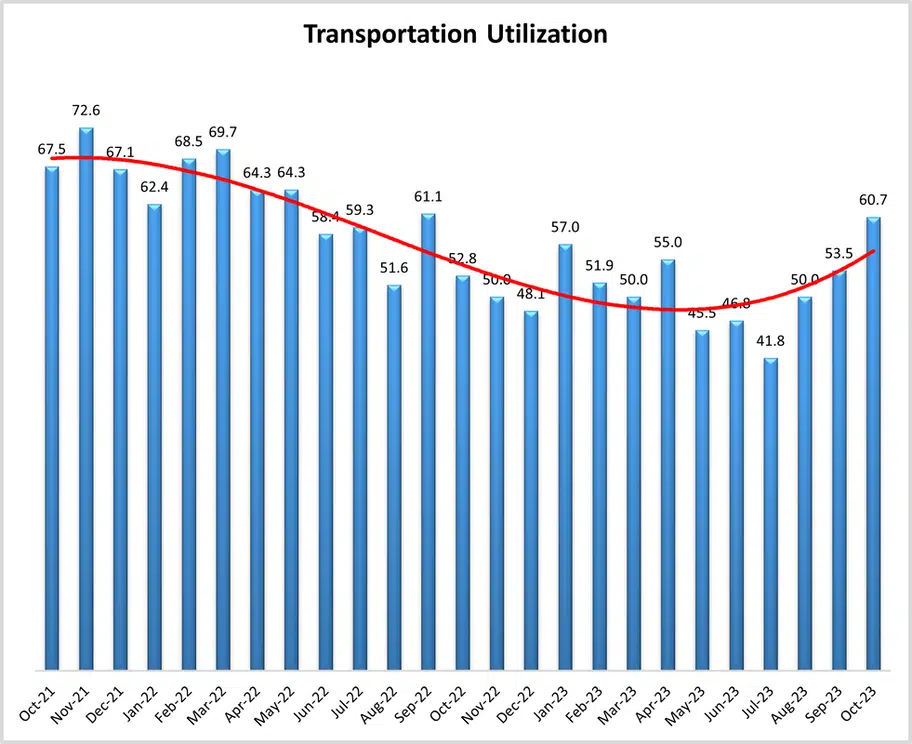
The Transportation Utilization Index registered 60.7 in October 2023. This corresponds to a jump of 7.2 percentage points from last month’s reading. With this increase, Transportation Utilization continues to rebound and is now at the highest level registered since September 2022. The Downstream Transportation Utilization Index is now at 72.2, while the Upstream index is now at 56.3. The future Transportation Utilization Index dropped slightly from the previous reading and indicates expansion at a 65.2 level for the next 12 months. As such expectations of increased Transportation Utilization remain strong and relatively uniformly dispersed across the supply chains with the Upstream Transportation Utilization index at 66.7 and the Downstream at 63.0.
Transportation Prices
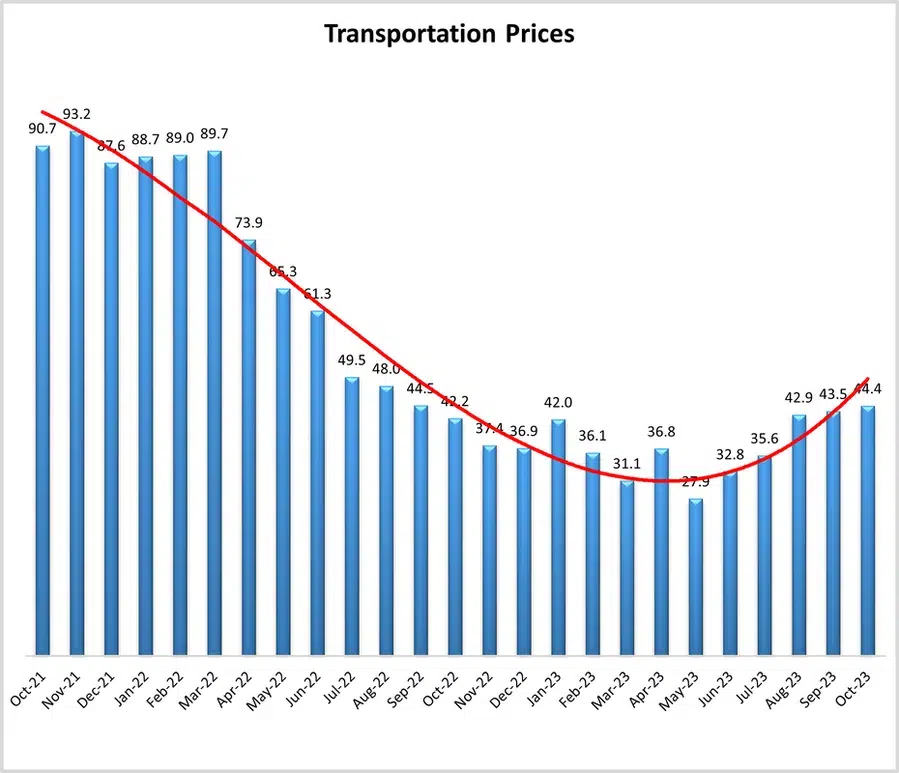
The Transportation Prices Index indicates 44.4 in October 2023, which corresponds to a small increase of .9 points from last month. Hence, the downward pressure on Transportation Prices eased a little more but the index remains in slight contraction territory. The Downstream Transportation Prices index is now at 53.7, indicating slightly increasing prices, while the Upstream index is at 40.6, continuing to indicate contraction. The future index for Transportation Prices dropped 4.4 points from last month and is now at 65.0, continuing to indicate expectations of higher Transportation Prices in the next 12 months. The Downstream Transportation Prices index is at 68.5 while the Upstream Transportation Prices index is at 64.1, so expectations of higher Transportation Prices in the next 12 months are relatively uniformly distributed across the supply chain.
Fuel
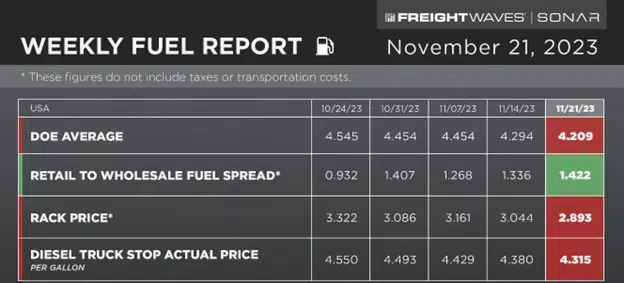
- Fuel is down .085 cents week over week.
- EIA price of fuel has declined 8 of the 9 past weeks.
- Over that 9 week period, fuel has declined 45 cents.
- Year over year, fuel has declined $1.024 on the national average.
Truckload
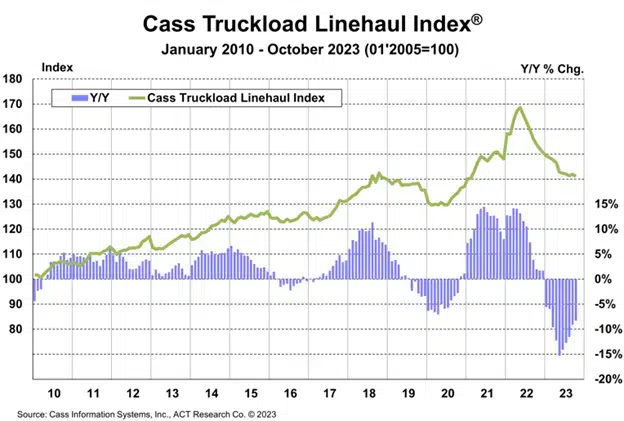
The Cass Truckload Linehaul Index fell 0.6% m/m in October to 141.1, after a 0.5% m/m increase in September.
- The October level was a new cycle low, but only 0.1% below August, as truckload rate trends have been stabilizing, albeit still finding a bottom.
- On a y/y basis, the Cass Truckload Linehaul Index fell 8.3% y/y in October, after a 9.1% y/y decline in September.
- From here, even modest sequential declines would be accompanied by slowing y/y declines.
American Trucking Associations’ advanced seasonally adjusted (SA) For-Hire Truck Tonnage Index increased 1.1% in October after declining 1.1% in September. In October, the index equaled 115.2 (2015=100) compared with 113.9 in September.
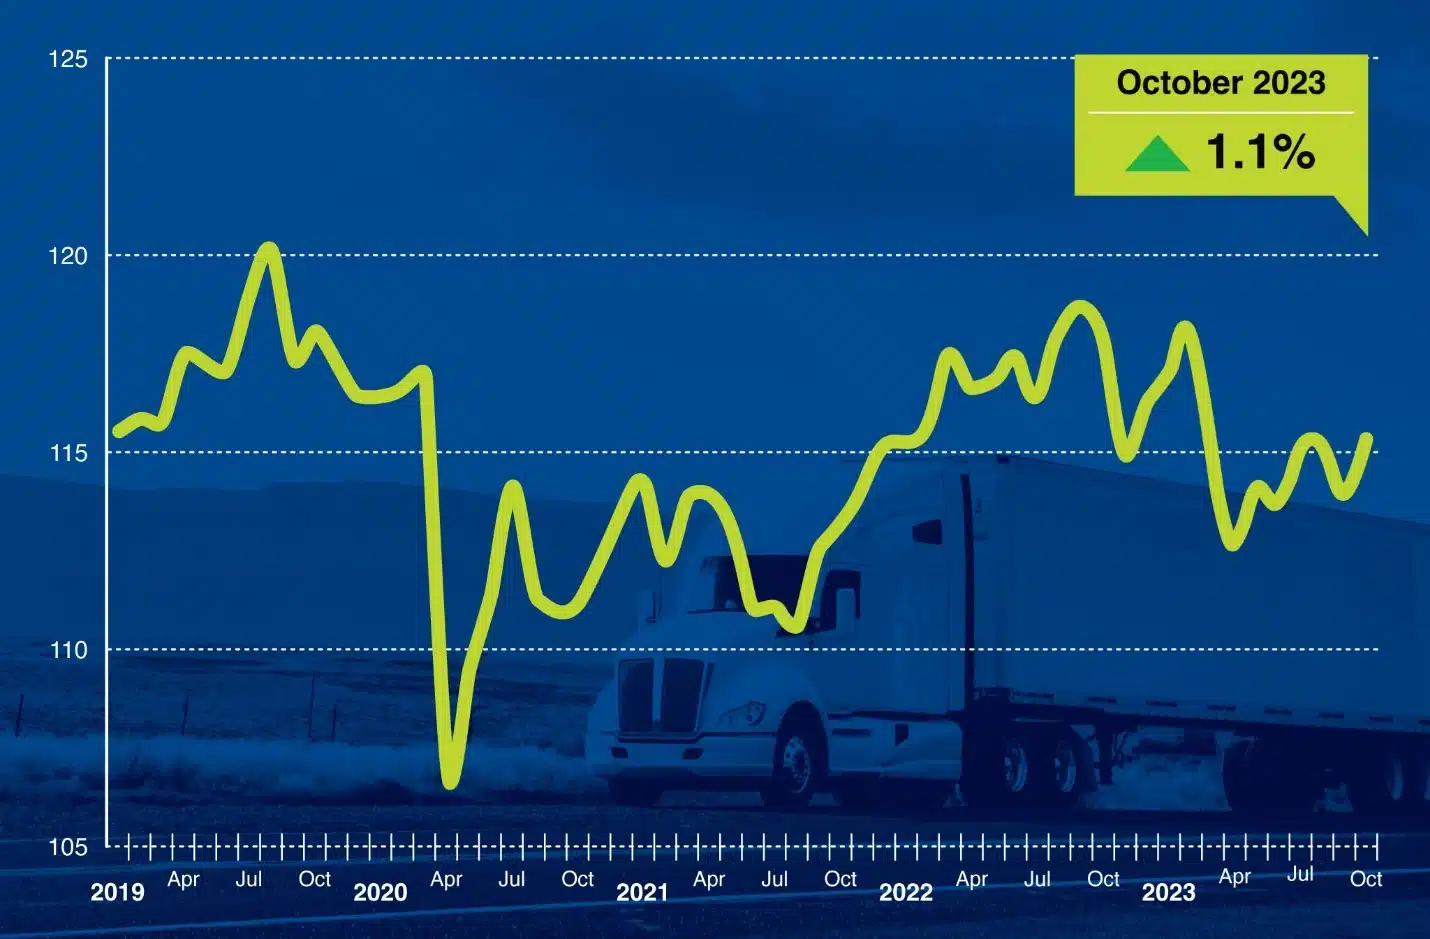
“After hitting a floor in April, tonnage has slowly and inconsistently improved, but remains 3% below its recent peak in September 2022,” said ATA Chief Economist Bob Costello. “Despite the monthly gain, truck freight remains soft as it continues to contract on a year-over-year basis. It is important to remember that our for-hire truck freight index, which includes both truckload and LTL freight, is dominated by contract freight with minimal amounts of spot market loads. The traditional spot market remains much weaker than contract tonnage.”
September’s decline was unchanged from the American Trucking Association’s October 24 press release.
Compared with October 2022, the SA index fell 2.1%, which was the eighth straight year-over-year decrease. In September, the index was down 4.1% from a year earlier.
The not seasonally adjusted index, which represents the change in tonnage hauled by the fleets before any seasonal adjustment, equaled 119.7 in October, 6.3% above the September level (112.5). In calculating the index, 100 represents 2015. ATA’s For-Hire Truck Tonnage Index is dominated by contract freight as opposed to spot market freight.
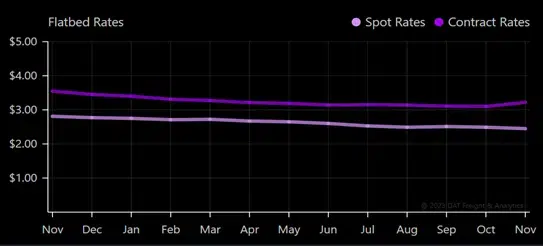
Flatbed Spot Rate
After being flat for most of October, Flatbed linehaul rates decreased by $0.01/mile to a national average of $1.87/mile, $0.20/mile lower than last year, and just $0.02/mile higher than in 2019. Compared to the pre-pandemic average for Week 41, last week’s national average was $0.09/mile lower and $0.35/mile lower than in 2018.
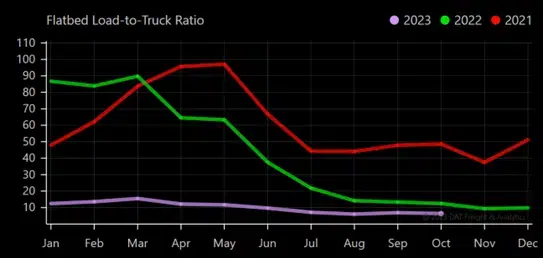
Flatbed Load to Truck Ratio
The volume of flatbed load posts (LP) followed the same dry van and flatbed downward trend, decreasing by just over 2% last week. Volumes remained around half what they were a year ago. Carrier equipment posts (EP) decreased 4% w/w, resulting in last week’s reefer load-to-truck ratio (LTR) increasing by 2% to 6.11, the lowest LTR in seven years.
LTL
The biggest sale of trucking assets in US history
- Yellow’s assets will be sold via auction or wholesale.
- Whoever purchases the 323 facilities would effectively control US LTL capacity.
- Estes and Old Dominion are the two main players.
- The winning bid will be announced Friday, Dec 1.
- Bids will be finalized on December 12th.
Estes has committed to investing more in technology.
- Estes has now fully recovered from last month’s cyberattack.
- They have committed to doubling down on technology investments.
- Customers that avoided Estes during the attack have now moved most of the freight back to Estes’ control.
Source: S&P Global Journal of Commerce
Where did Yellow’s freight go?
- All publicly traded LTL companies reported an increase in freight.
- Saia reported an 11.3% increase in shipments per day Q/Q.
- On average, most carriers saw a 5% increase in shipments during the quarter.
- ODFL saw a 5.7% increase in daily shipments.
- XPO saw per-day shipment counts increase by 1,000 in each month of Q3.
- TForce saw a 5.1% increase but has experienced slippage over the recent weeks.