Transportation Update
DAT Freight Summary
- Market recovery in 2023 unlikely.
- A muted peak import season and lower production in freight-centric sectors, including the manufacturing of paper, wood, plastic, and rubber products, suggest a freight recovery in 2023 is improbable.
- Dry van spot market load posts lost the prior week’s gain following last week’s 11% week-over-week decline.
- Load posts are 40% lower than last year and 25% below 2019 levels.
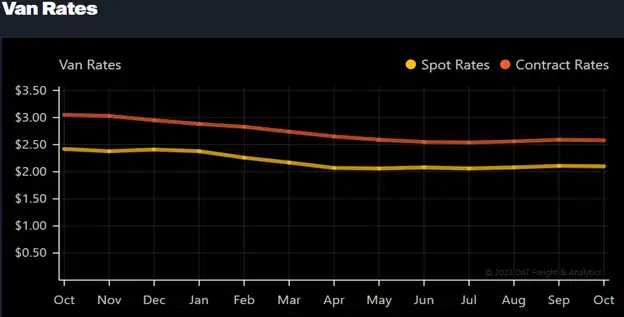
- At just over $1.57/mile, dry van linehaul spot rates are 15% (or $0.28/mile) lower than last year.
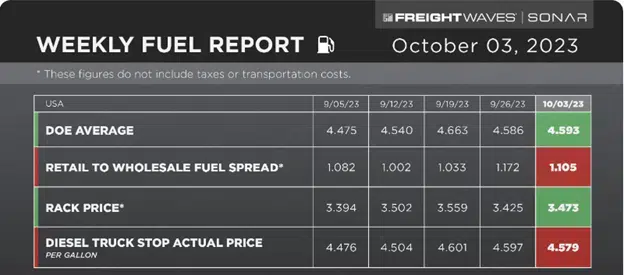
National Fuel Average
Fuel
- Fuel has leveled off at an average of $4.60/gal over the past month.
- This is up $0.007 from a week ago.
- This is down $0.243 from last year.
- The average retail price of diesel, the primary fuel for Class 8 trucks, has increased 16% since the end of July.
Forecasts from the EIA
- Global oil production. This Short-Term Energy Outlook(STEO) incorporates Saudi Arabia’s September 5 announcement to continue its voluntary crude oil production cut of 1 million barrels per day (b/d) through the end of this year. Previously, the voluntary cut was set to expire at the end of September. Global oil inventories in our forecast fall by 0.2 million b/d in the fourth quarter of 2023 (4Q23) based on the extension of this production cut.
- Crude oil prices. We expect the Brent crude oil price to average $93 per barrel (b) during 4Q23, up from $86/b in August. A decline in global oil inventories in the coming months supports the Brent price in our forecast. The price eases to an average of $87/b by the second half of 2024 because we expect global oil inventories to rise during that period.
| Notable Forecast Changes
The current STEO forecast was released September 12. The previous STEO forecast was released August 8. | 2023 | 2024 |
| Total U.S. liquid fuels consumption (current forecast) (million barrels per day) | 20.1 | 20.3 |
| Previous Forecast | 20.5 | 20.7 |
| Percentage Change | -1.6% | -2.2% |
| U.S. gasoline consumption (current forecast) (million barrels per day) | 8.9 | 8.7 |
| Previous Forecast | 8.9 | 8.9 |
| Percentage Change | -0.4% | -2.0% |
| U.S. diesel retail price (current forecast) (dollars per gallon) | $4.31 | $4.07 |
| Previous Forecast | $4.17 | $3.94 |
| Percentage Change | 3.5% | 3.4% |
| U.S. real gross domestic product (current forecast) (percentage) | 2.2% | 1.4% |
| Previous Forecast | 1.9% | 1.2% |
| Percentage Point Change | 0.3 | 0.2 |
The current STEO forecast was released September 12.
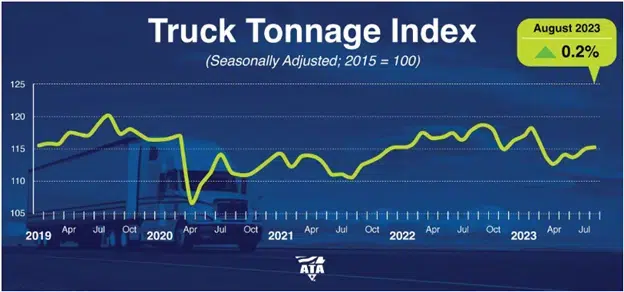
Freight Tonnage
- American Trucking Associations’ advanced seasonally adjusted (SA) For-Hire Truck Tonnage Index increased 0.2% in August after rising 1.1% in July. In August, the index equaled 115.3 (2015=100) compared with 115 in July.
- Compared with August 2022, the SA index fell 2.3%, which was the sixth straight year-over-year decrease. In July, the index was down 1.2% from a year earlier.
- According to ATA Chief Economist Bob Costello, “The evidence is growing that tonnage hit bottom in April and continues its slow climb upwards. However, year-over-year comparisons remain difficult as tonnage peaked in September of last year. As a result, it is unlikely that tonnage turns positive compared with a year earlier for at least a month or two longer. Most recently, freight continues to be mixed, with consumer spending and factory output flat to down.”
Index 2.3% Below August 2022
Truckload
- The truckload market is still deteriorating.
- Spot rates are still trending lower but are being masked by higher fuel prices.
- This is atypical for end of quarter.
- This could possibly increase the amount of capacity existing the market.
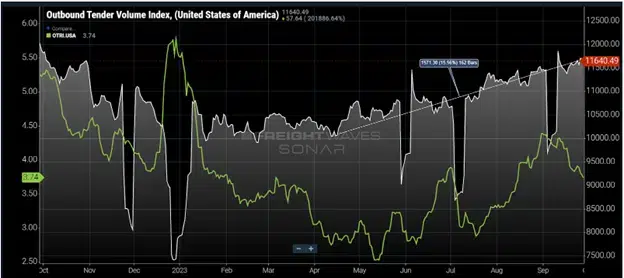
Demand has been slowly increasing since April, as shown in the white in the chart above.
- Total tenders have increased 15% since then.
- This has had a negligible impact on carrier availability, as rejection rates remain below 4% (shown in green on the chart) which is considered deflationary.
In conclusion, there is still not enough freight to support the available capacity. Sharply rising fuel prices will only make the environment more challenging for carriers, especially ones who rely on spot market volumes. Carrier costs have risen quickly in a market that does not allow for price increases.
Shippers should prepare for a tighter market in 2024. Even if demand does not hold, the rate of capacity’s exodus will eventually catch up.
LTL
- The fallout from the Yellow bankruptcy is still coming into focus 2 months after the fact.
- 35% of all shippers are looking for a new permanent carrier for their shipments.
- Pricing, service, and network fit are the main drivers of this.
- Half of the 35% said that they want to make a carrier change in Q4.
- The other half stated that they would wait until the first half of next year.
- LTL Carriers were easily able to absorb the freight although it may not have happened as expected.
- The top 5 carriers had the ability to absorb the freight. However, the freight was redistributed to many smaller, regional carriers.
- ArcBest reported a 20% increase in volume with its core customers.
- Saia’s shipments had a 14% YoY increase.
- XPO had an over 8% increase in volumes as well.
- 7% of carriers polled by Freightwaves said the ex-Yellow customers weren’t a good fit for their network.
- 46% of all carriers stated that the pricing and freight mix was much worse than its base business.
- Almost all shippers polled stated that they were at least somewhat happy with the service of their new provider.
- Only 13% of shippers said that they were not at all happy with their new pricing.
- The top 5 carriers had the ability to absorb the freight. However, the freight was redistributed to many smaller, regional carriers.
- Estes has set the floor price for the Yellow terminals liquidation.
- Estes has offered $1.525 billion.
- The deadline for the terminal bid is November 9.
- The auction is scheduled for November 28, if needed.
- Yellow has set an Oct. 13 bid deadline for the roughly 11,700 tractors and 35,000 trailers.
- An Oct. 18 auction will follow as needed.
- Estes was hit by a cyberattack on Monday and is still reeling from the issue.
- The company is actively working to repair the IT infrastructure while continuing their core operations.
- Estes stated, “Terminals and drivers are effectively picking up and delivering freight while we work through this event.”
- Estes has requested to have any questions or concerns addressed to your account manager, preferably by text.
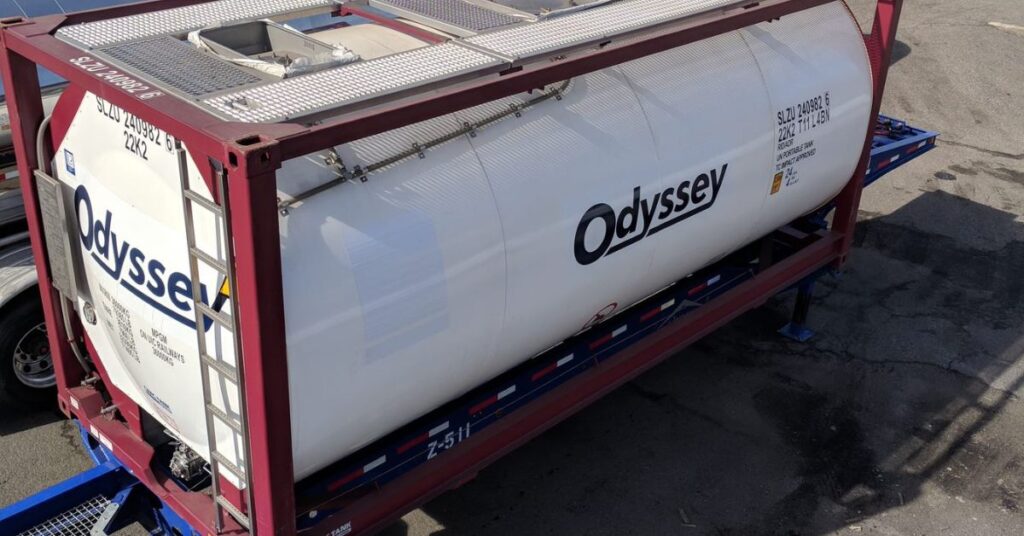
Bulk and Tank Truck
Odyssey clients are curious as to why the bulk market doesn’t always trend with the dry van market. Prices tend to be more stable in the bulk world and here are some reasons why:
- Driver Pay
- Drivers in bulk/tank are paid approximately 10% higher than in other trucking segments in 2023.
- Compensation increases depend on pay structure.
- per mile compensation – 2%
- percentage of revenue or load – 2%
- per hour – 2%
- salaried or per day – 6%
- Drivers in bulk/tank are paid approximately 10% higher than in other trucking segments in 2023.
- Length of Haul
- 57% of tank/bulk haulers reported their average haul time as short haul (less than 200 miles).
- 31% reported they drove intermediate haul, or 201-500 miles.
- As a result, tractors are actively on the road longer throughout their lives.
- Due to recent supply chain issues, tractors are being utilized longer which means higher repair costs.
- On a year-over-year basis, combined parts and labor costs rose only 5.57% in Q2 compared with the same period last year
- This is far slower than the 15% increase in costs seen in 2022.
- Driver Benefits
- Bonuses
- Sign on bonuses have been level this year, but only after a 70% increase from 2021 to 2022.
- Tenure bonuses can average a 2% increase.
- Additional bonuses come in the form of safety, referrals, of fuel efficiency.
- Bonuses
- Company Subsidized Benefits
- Medical Plans
- PTO in all forms; Vacation, holiday, and sick leave among others
- Various insurances; Life, medical, and disability among others