Reliability is the new rate in metals logistics
For the last three years, the spot freight market rewarded shippers who treated carrier selection like day-trading — hunt the best rate available, move on.
For the last three years, the spot freight market rewarded shippers who treated carrier selection like day-trading — hunt the best rate available, move on.

The freight downturn is ending, and the advantages won’t be evenly distributed. Recoveries reward the quick — and in today’s landscape, velocity is a technology

The May 2026 Market Outlook includes key network indicators, shipper actions, economic updates, manufactured goods and transportation updates from Odyssey.

The April 2026 Market Outlook features key network indicators, shipper actions, economic updates, manufactured goods and transportation updates from Odyssey.

Cost, service, and sustainability are sometimes described as a freight “trilemma”: optimizing any two means conceding the third. In 2026, cost is the top priority.

The March 2026 Market Outlook highlights key network indicators, shipper actions, economic updates, manufactured goods and transportation updates from Odyssey.

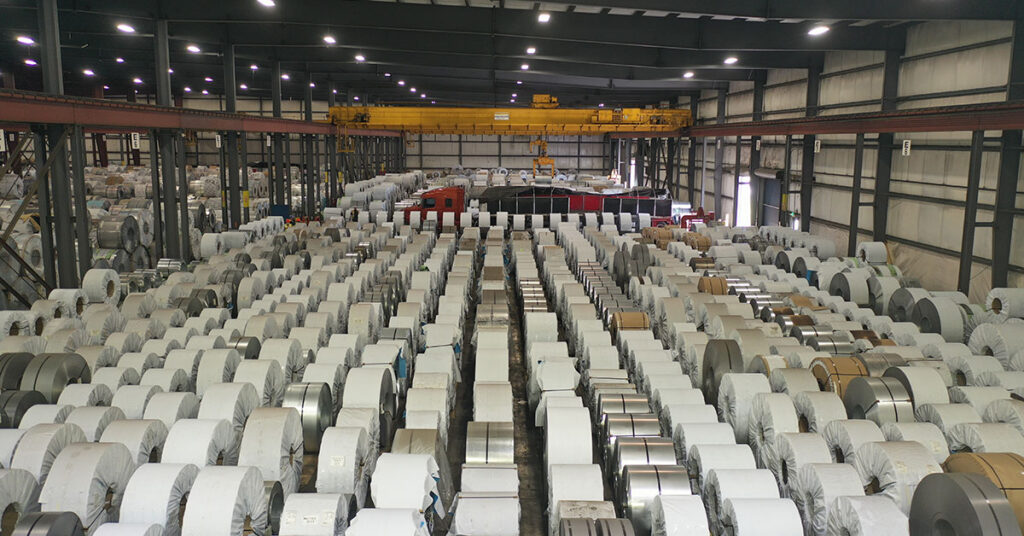
In late 2025, a major aluminum coil supplier experienced a series of fires at its main production facility. The plant supplied a significant share of

Tightening cycles are proving that freight contract management is no longer just a procurement exercise. It is a data and technology problem — one that

The February 2026 Market Outlook highlights key network indicators, shipper actions, economic updates, manufactured goods and transportation updates from Odyssey.